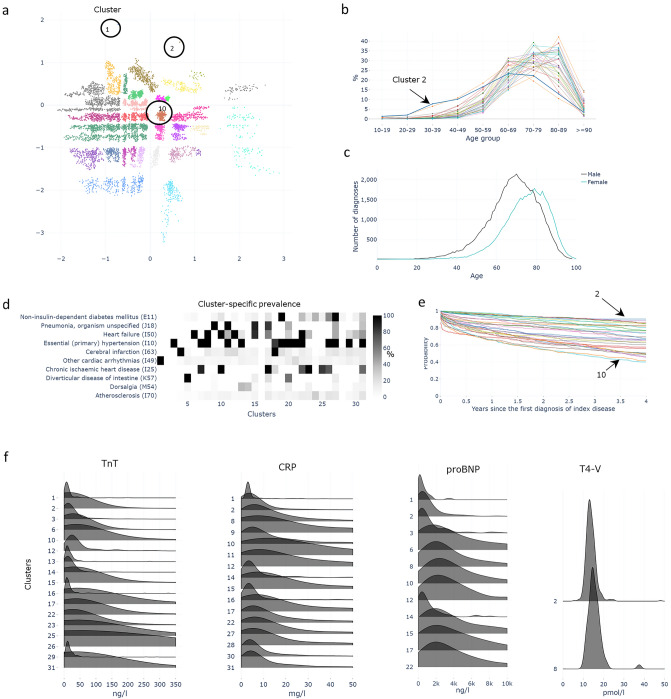
Figure 4.
Atrial fibrillation. (a) Disease-specific comorbidity clusters represented in two-dimensional latent space of VAE model. (b) Age distribution of the clusters, and (c) age- and sex distributions of I48 diagnosis among original 1 M patients (d) The prevalence of the 10 most frequent diagnoses in comorbidity clusters shown on a heat map. Some diagnoses, e.g. other cardiac arrythmias, diabetes mellitus, and diverticular disease of the intestine, demonstrate cluster specificity, whereas pneumonia, heart failure, hypertension, and ischemic heart disease are more widely distributed across clusters. (e) Kaplan–Meier plot showing variation in cluster-specific survival rates. (f) Distribution of laboratory measurements of selected tests. Only clusters with statistically significant (FDR 0.1%) results shown.

