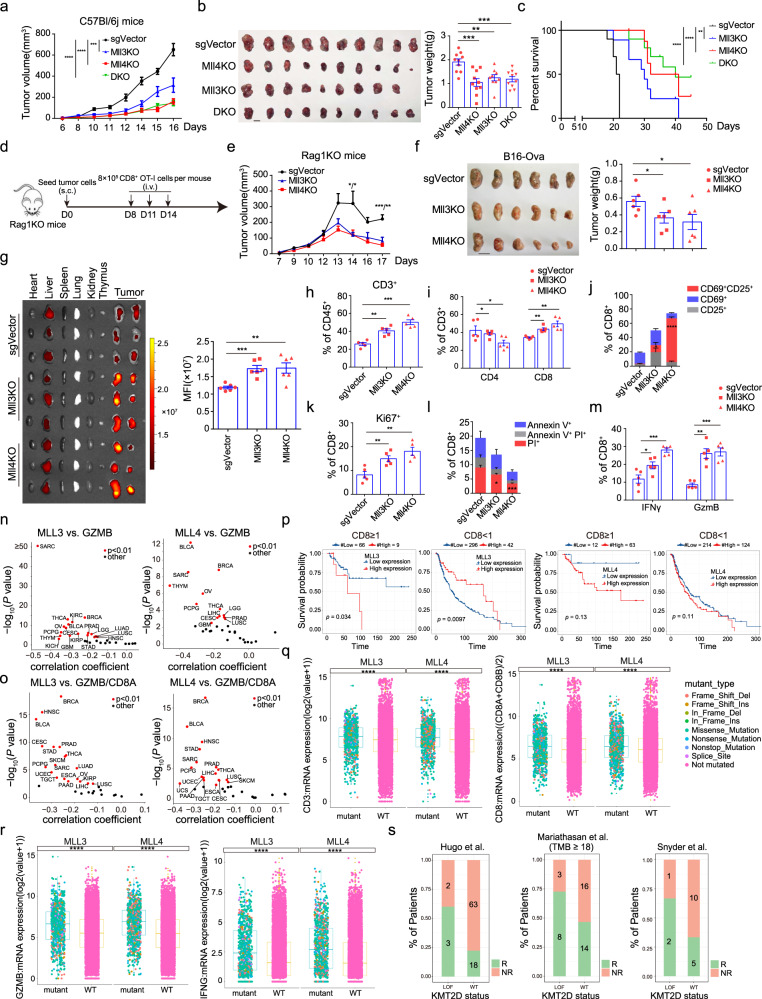
Fig. 2. Tumor-cell loss of Mll3 or Mll4 enhances CD8+ T-cell function and promotes tumor immunosuppression in vivo.
a, b Tumor growth curve (a) and tumor images and weight quantification at the experimental endpoint (b) (mean ± SEM, n = 10). c Kaplan–Meier survival curves for mice in (a). d Diagram for the adoptive transfer of CFSE-labeled OT-I CD8+ T cells into Rag1−/− mice (n = 3) bearing indicated B16-Ova tumors. e, f Tumor growth curve (e) and tumor images and weight quantification at the time of mice sacrifice (f) (mean ± SEM, n = 6). g Tissue distribution and quantification of fluorescent signal 3 days post the last OT-l T transfer as outlined in (d). Fluorescent intensity in tumors was shown as mean ± SEM (n = 6). h, i Frequency for infiltrated total (h), CD4+ and CD8+ T cells (i) in indicated B16 tumors of C57BL/6J mice 14 days post implantation (mean ± SEM, n = 5). j–m Mice were treated as in (h). Activation (j), proliferation (k), apoptotic states (l), and cytotoxicity (m) of CD8+ T cells were shown as mean ± SEM (n = 5). n, o Volcano plots showing the Spearman’s correlation and estimated significance for indicated pairs in RNA-seq datasets across TCGA cancer types88. Each dot represents a cancer type and significant correlations are highlighted in red. p Kaplan–Meier survival curves for SKCM (Skin Cutaneous Melanoma) patients with differential mRNA levels of MLL3 or MLL4 and CD8 [(CD8A + CD8B)/2]. For CD8 ≥ 1, Mll3low (n = 66), Mll3high (n = 9), Mll4low (n = 12), Mll4high (n = 63); For CD8 < 1, Mll3low (n = 296), Mll3high (n = 42), Mll4low (n = 214), Mll4high (n = 124). q, r Boxplots of total and CD8+ T cells infiltration (q) and expression of cytotoxic effectors (r) in TCGA pan-cancer patients bearing wild-type or genetically altered MLL3 or MLL4. Center line, median; box bounds, upper and lower quartiles; whiskers, 1.5× IQR (interquartile range). s Clinical response of PD-L1-PD1 blockade therapy in melanoma and urothelial cancer patients bearing wild-type or genetically inactivated MLL444–46. R responder, NR nonresponder. Statistical significance was determined by two-tailed unpaired t (b, f, g, h–m), two-way ANOVA (a, e), log-rank (Mantel–Cox) test (c), cor.test (n, o), log-rank test (p) or two-sided Wilcoxon test (q, r).*P < 0.05; **P < 0.01; ***P < 0.001.

