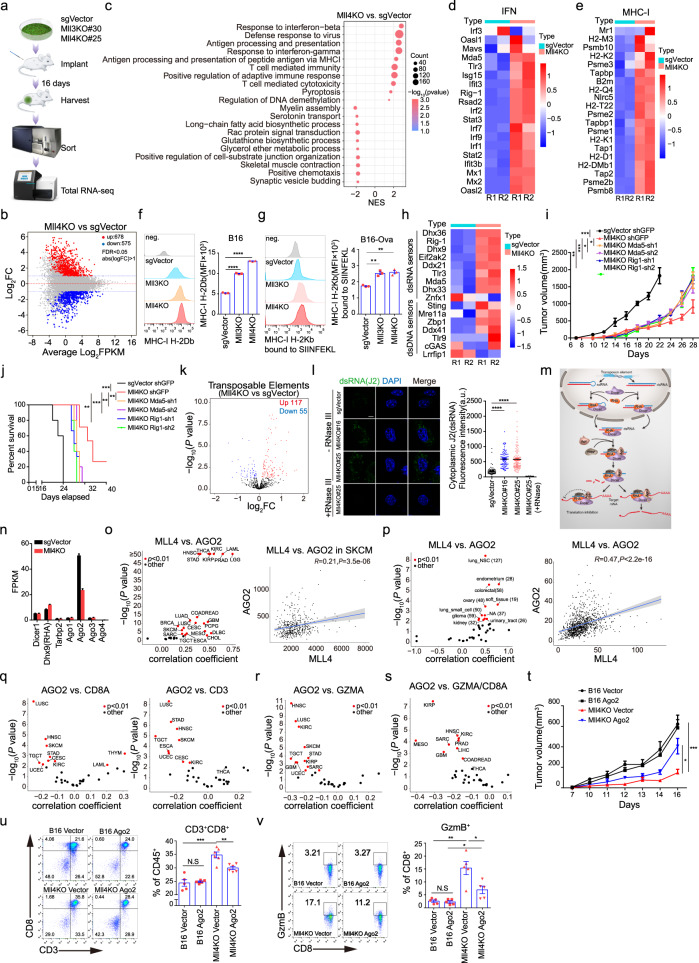
Fig. 3. Mll3 or Mll4 ablation increases the cytosolic dsRNAs level to elicit interferon response through attenuation of RISC function.
a Flowchart for total RNA-seq analyses of indicated B16 tumor cells from C57BL/6J mice (n = 2). b, k M-versus-A (MA) and volcano plots showing differentially expressed protein-coding (b) and ERV (k) transcripts in Mll4−/− tumor cells (n = 2). c Gene set enrichment analysis (GSEA) of differentially expressed genes in Mll4−/− tumor cells (n = 2). d, e, h Heatmaps showing Z-score expression of indicated genes in control and Mll4−/− tumor cells (n = 2). f, g Cell-surface levels of free (f) and antigen-bound MHC I (g) in indicated B16-Ova cells (mean ± SEM, n = 3). i, j Tumor growth (i) and survival curves (j) of C57BL/6J mice bearing indicated B16 tumors (mean ± SEM, n = 5). l Representative images and quantification of intracellular dsRNA immunostaining in control and Mll4−/− B16 cells with or without RNase III treatment (mean ± SEM, n = 50). Scale bar, 10 μm. m Schematic diagram of dsRNAs regulation by RISC complex. n RNA-seq FPKM value for indicated genes in control and Mll4−/− tumor cells (mean ± SEM, n = 2). o, p Spearman’s correlation for the expression of MLL4 with AGO2 in all TCGA tumor types (o, left), SKCM (o, right), and CCLE cancer cell lines with or without tissue origin categorization (p) Red dots indicate cancer types with significant correlations. Blue line, linear regression fit; Shaded area, 95% confidence interval. Value in (p, left) indicates the number of cancer cell lines of same tissue origin. q–s TCGA pan-cancer analyses of the Spearman’s correlation and for indicated pairs. t Growth curves for the indicated B16 tumors in C57BL/6J mice were shown as mean ± SEM (n = 5). u, v Frequency (u) and cytotoxicity (v) of CD8+ T cells in tumors described in (t). Quantifications were shown as mean ± SEM (u, B16 Vector and B16 Ago2, n = 5; Mll4KO Vector and Mll4KO Ago2, n = 6. v n = 5). Statistical significance was determined by quasi-likelihood F test (b, k), permutation test (c), two-tailed unpaired t (f, g, l, u, v), two-way ANOVA (i, t), cor.test (o–s) or log-rank (Mantel–Cox) test (j). *P < 0.05; **P < 0.01; ***P < 0.001.

