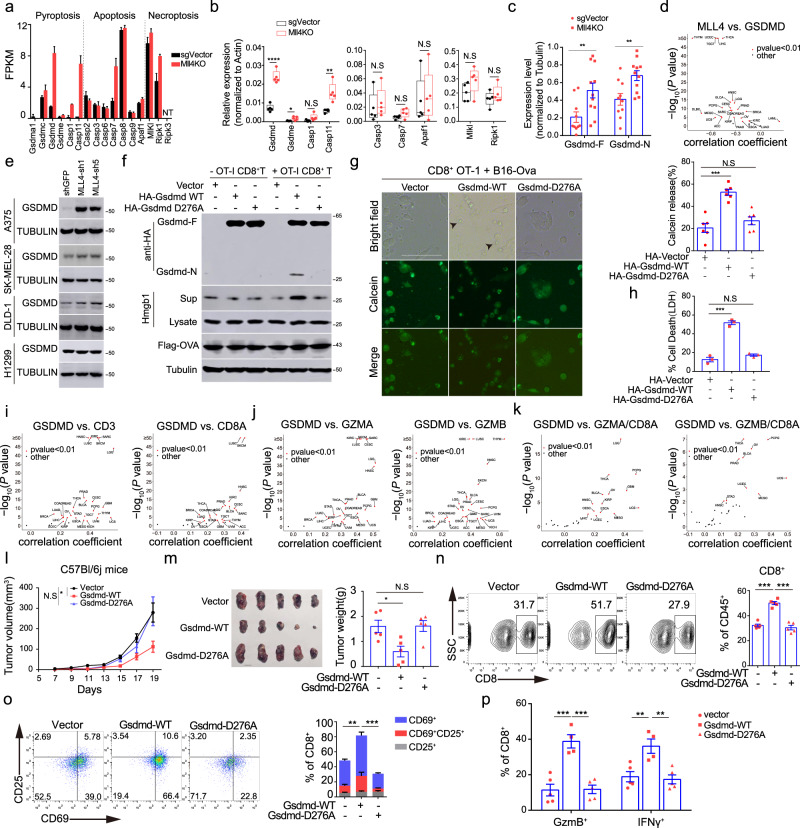
Fig. 4. Mll4 ablation derepresses GSDMD to mediate pyroptosis in B16 melanoma cells.
a RNA-seq FPKM value for indicated genes in control and Mll4−/− tumor cells (mean ± SEM, n = 2). b Box plot showing expression of indicated genes in control and Mll4−/− B16 bulk tumors (n = 5). Center line, mean; box bounds, upper and lower quartile; whisker, maximal and minimal value (n = 5). c Levels of full-length or the truncated N-terminal GSDMD protein in control and Mll4−/− B16 bulk tumors are shown as mean ± SEM (sgVector, n = 10; Mll4KO, n = 11). d, i–k Volcano plots showing TCGA pan-cancer RNA-seq analyses of the Spearman’s correlation for the indicatedcomparisons. e Immunoblotting analyses of GSDMD level in human cancer cell lines with or without MLL4 knockdown. f, h OT-1 T cells were incubated with B16-Ova cells expressing vehicle, WT or mutant Gsdmd at an E/T ratio of 10:1 for 24 h. Levels of indicated protein in co-culture supernatant and tumor-cell extracts were analyzed by immunoblotting (f). Tumor-cell death was determined by LDH release and shown as mean ± SEM from technical triplicates in one of biological replicates (h). g B16-Ova cells expressing vehicle, WT or mutant Gsdmd were preloaded with calcein AM and then co-cultured with OT-I CD8+ T cells at an E/T ratio of 10:1 for 12 h. Representative images are shown with arrowheads indicating tumor cells undergoing pyroptosis. Scale bar: 20 μM. Quantification is shown as mean ± SEM from three biological replicates. l, m Tumor growth over time (l), photographs and weight quantification at the time of experimental endpoint (m) in C57BL/6J mice implanted with indicated B16-Ova cells were shown as mean ± SEM (n = 5). n–p Infiltration (n), activation (o) and cytotoxicity (p) of CD8+ T cells in tumors of C57BL/6J mice implanted with indicated B16-Ova cells. Quantifications were shown as mean ± SEM (vector and Gsdmd-D276A, n = 5; Gsdmd-WT, n = 4). All immunoblots are representative from biological replicates. Statistical significance was determined by two-tailed unpaired t test (b, c, g, h, m, n, o, p), cor.test (d, i–k) or two-way ANOVA (l). *P < 0.05; **P < 0.01; ***P < 0.001.

