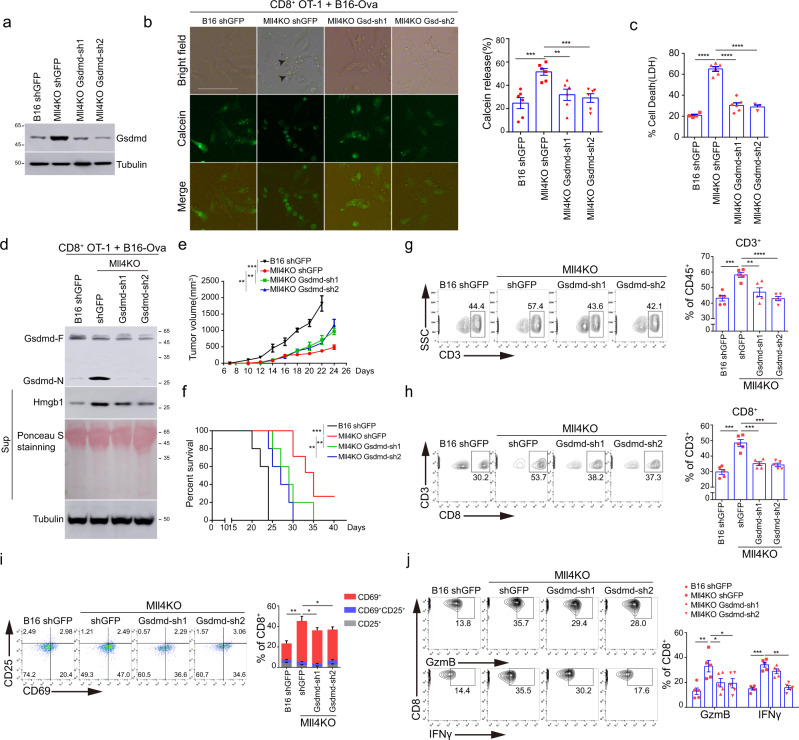
Fig. 5. GSDMD depletion attenuates tumor-cell pyroptosis and the immunosuppressive effects of CD8+ T cells on Mll4−/− tumors.
a GSDMD level in control or Mll4−/− B16-Ova cells lentivirally transduced with Gsdmd shRNAs. Shown are representative results from two independent experiments. b Control or Mll4−/− B16-Ova cells depleted for GSDMD expression were preloaded with calcein AM and then co-cultured with OT-I CD8+ T cells at an E/T ratio of 10:1 for 12 h. Representative images are shown with arrowheads indicating tumor cells undergoing pyroptosis. Scale bar: 20 μm. Quantification of released calcein AM is shown as mean ± SEM from five technical replicates in one of two independent experimentsc Control or Mll4−/− B16-Ova cells depleted for GSDMD expression were treated as in (b) except for 24 h of co-culture. T-cell-mediated killing was determined by LDH release-based cell death analysis and shown as mean ± SEM from technical triplicates in one experiment of biological replicates. d Control or Mll4−/− B16-Ova cells depleted for GSDMD expression were treated as in (b) except for 24 h of co-culture. GSDMD cleavage and HMGB1 release from target cells were analyzed by immunoblotting. Shown are representative results from one experiment of biological replicates. e, f Control or Mll4−/− B16 cells depleted for GSDMD expression were inoculated into C57BL/6J mice. Tumor growth (e) and Kaplan–Meier curves for mice survival (f) were recorded (mean ± SEM, n = 5). g–j Control or Mll4−/− B16 cells depleted for GSDMD expression were inoculated into C57BL/6J mice. Intratumoral frequency of total T (g) and CD8+ T (h) cells, activation (i) and cytotoxicity (j) of infiltrated CD8+ T cells were analyzed by flow cytometry and represented as mean ± SEM (n = 5). Statistical significance was determined by two-tailed unpaired t (b, c, g–j), two-way ANOVA (e) or log-rank (Mantel–Cox) test (f). *P < 0.05; **P < 0.01; ***P < 0.001.

