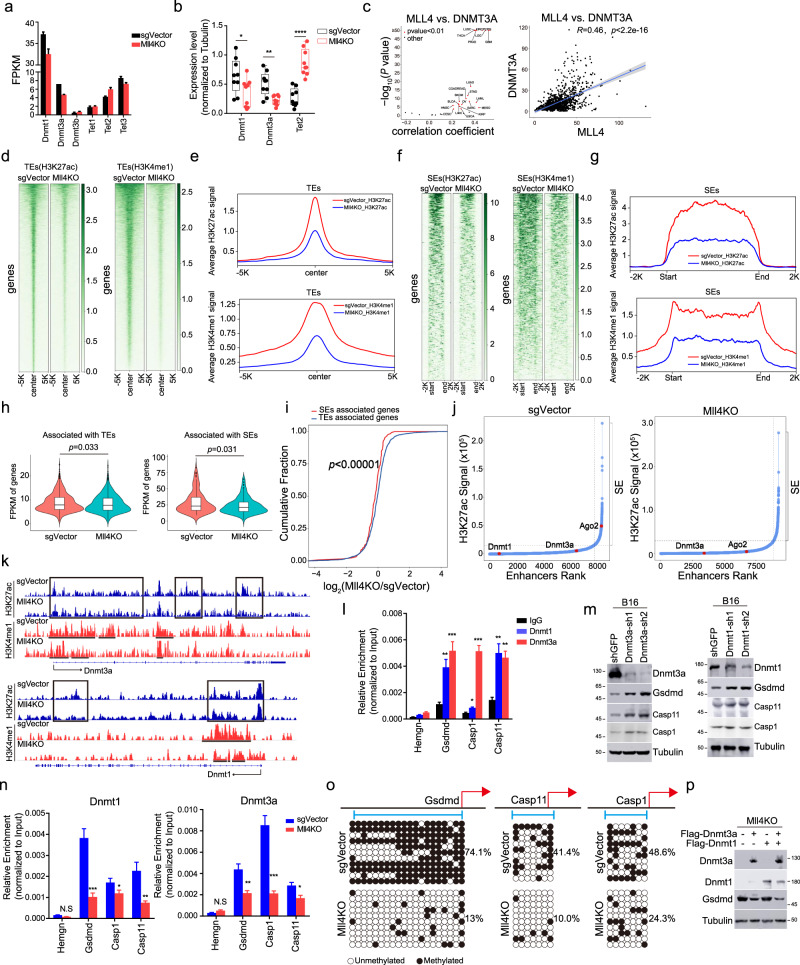
Fig. 6. Mll4 deletion transcriptionally elevates Gsdmd expression through attenuating enhancer activity of Dnmt3a and Dnmt1.
a RNA-seq FPKM value for indicated genes in sorted control and Mll4−/− tumor cells (mean ± SEM, n = 2). b Levels of indicated protein in control or Mll4−/− B16 bulk tumors (mean ± SEM, n = 9). c Volcano and scatter plots showing the Spearman’s correlation between MLL4 and DNMT3A mRNA levels across TCGA human cancer types (left) and CCLE cancer cell lines (right). Shaded area, 95% confidence interval. d–g Heatmaps and metaplots showing H3K27ac and H3K4me1 signals at typical enhancers (d, e) and super enhancers (f, g) in control and Mll4−/− B16 cells. h Violin plots comparing transcript levels of typical or super enhancers associated genes in sorted control and Mll4−/− B16 tumor cells (n = 2). Center line, median; box, upper and lower quantiles; whisker, maximal and minimal values. i Cumulative distribution plot of log2 fold changes in RNA expression of genes associated with typical and super enhancers in sorted control and Mll4−/− B16 tumor cells (n = 2). j H3K27ac signal in an increasing order across all enhancers in control and Mll4−/− B16 cells. Super enhancers are defined as the group of enhancers above the inflection point of the curve. k IGV browser tracks showing H3K4me1 and H3K27ac occupancy at indicated loci in control and Mll4−/− B16 cells. l, n DNMT3A and DNMT1 occupancy at indicated genomic loci in B16 cells (l) or in control and Mll4−/− B16 cells (n) were shown as mean ± SD from technical triplicates in one of two biological replicates. m, p Immunoblotting analyses of indicated protein in B16 cells with Dnmt3a or Dnmt1 depletion (m) or in Mll4−/− B16 cells expressing Dnmt3a and Dnmt3b alone, or in combination (p) Shown are representative results from biological replicates. o Lollipop representation of DNA methylation status at indicated gene promoter. Filled circles, methylated CpGs; open circles, unmethylated CpGs. Statistical significance was determined by two-tailed unpaired t (b, l, n), cor.test (c), two-sided Mann–Whitney U test (h) or two-sample Kolmogorov–Smirnov test (i). n.s not significant, *P < 0.05; **P < 0.01; ***P < 0.001.

