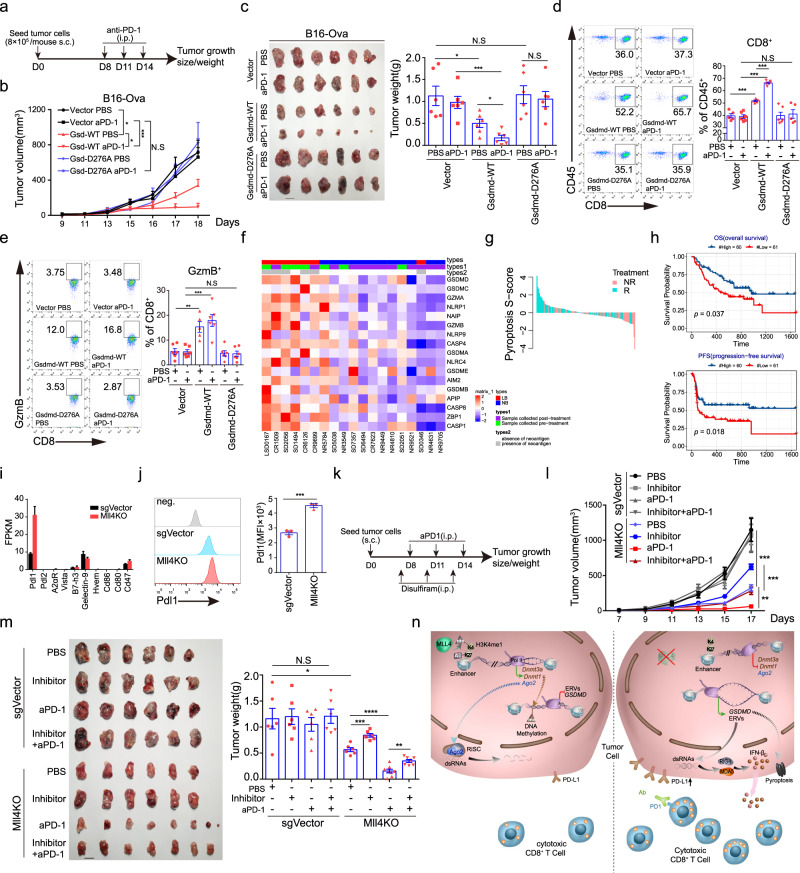
Fig. 7. Blocking GSDMD-mediated tumor-cell pyroptosis abrogates immunotherapeutic efficacy of anti-PD-1 blockade in Mll4−/− tumors.
a Experimental schedule for anti-PD-1 treatment in C57BL/6J mice. b Tumor growth curve in mice described in (a) (mean ± SEM, n = 6). c Tumor images and weight quantification at the time of experimental endpoint in mice described in (a) (mean ± SEM, n = 6). d, e Frequency (d) and cytotoxicity of CD8+ T cells (e) in tumors of mice described in (a) (mean ± SEM, n = 6 for all groups except for Gsdmd-WT treated with PBS, in which n equals 5_). f Heatmap showing expression of pyroptosis-related genes in tumors from anti-CTLA4 treated metastatic melanoma patients who achieve long-term (LB, complete and partial response or progression-free survival over 6 months) or no benefit (NB, progressive disease)66. g A waterfall plot showing the pyroptosis S-score in tumors from metastatic melanoma patients who respond or do not respond to anti-PD-1 immunotherapy68. h Kaplan–Meier curves showing overall and progression-free survival of melanoma patients splitted by pyroptosis S-score68 (high S-score, n = 60; low S-score, n = 61). i RNA-seq FPKM values for negative regulators of anti-tumor immune response in sorted control or Mll4−/− B16 tumor cells of C57BL/6 J mice (mean ± SEM, n = 2). j Representative flow histograms and quantification of cell-surface expression of PD-L1 in control and Mll4−/− B16 cells. Quantification of MFI was shown as mean ± SEM from technical triplicates in one of biological replicates. k Experimental design for the treatment of C57BL/6J mice with control or Mll4−/− B16 tumors. l, m Tumor growth (l), and tumor images and weight quantification (m) were shown as mean ± SEM (n = 6 for all groups except for Mll4KO groups treated with aPD-1 alone or together with disulfiram, in which n equals 8). n A proposed model summarizing the role and molecular mechanisms of Mll4 in immunosuppression and tumor immune evasion. Statistical significance was determined by two-tailed unpaired t (c, d, e, j, m), two-way ANOVA (b, l) or log-rank test (h). *P < 0.05; **P < 0.01; ***P < 0.001.

