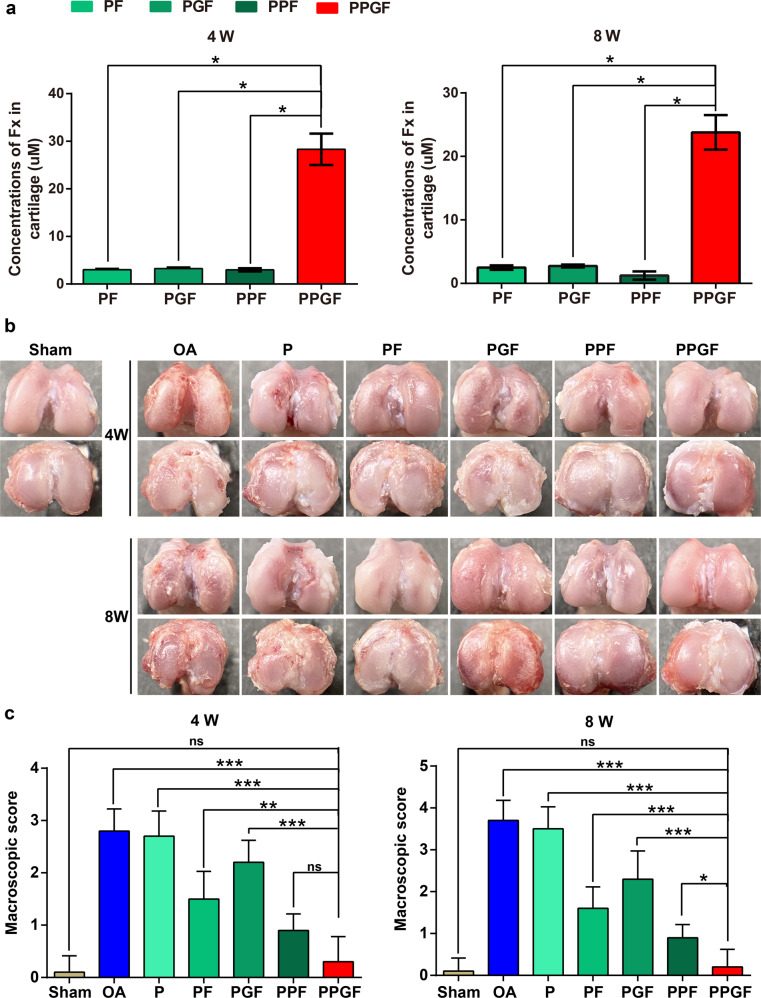
Fig. 8. Macroscopic evaluation of articular treated by nanofiber membranes.
a The concentration of Fx in the cartilage after implantation of the nanofiber membranes for 4 and 8 weeks. b Macroscopic appearance and c score of articular from the distal femur and tibial plateau after treatment by nanofiber membranes for 4 and 8 weeks. The values were presented as mean ± SD (n = 5; statistics: one-way ANOVA; ns means p > 0.05, * means p < 0.05, ** means p < 0.01, *** means p < 0.001).

