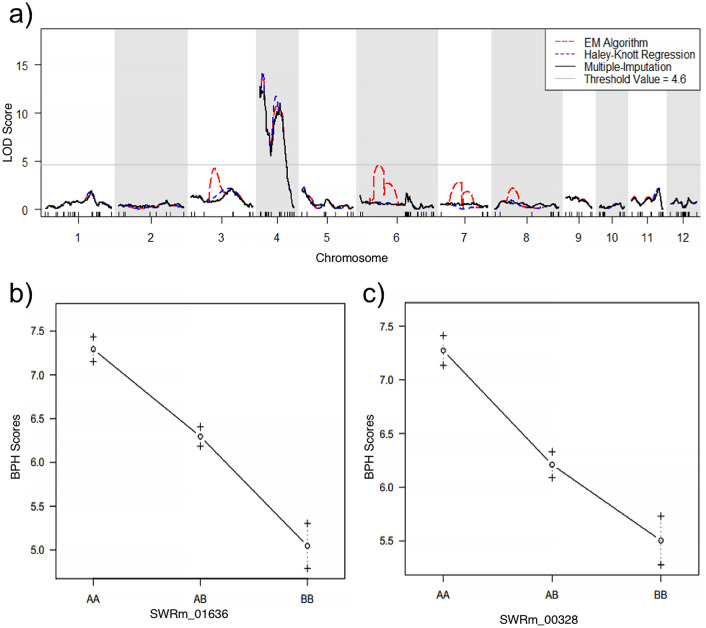
Figure 1.
QTL mapping and effect plots of SWR66 × SWD10 F2 mapping population. (a) QTL mapping results of F2 mapping population. Results of three algorithms used are indicated with red (EM algorithm), blue (Haley Knott Regression) and black (multiple imputation) lines. The grey line indicates the LOD threshold value of 4.6 detected by performing a 1000 permutation test using the EM algorithm. The LOD threshold values detected by 1000 permutation tests for the HK algorithm and multiple imputation are 4.34 and 4.19, respectively. Two major QTLs are identified on chromosome 4. The highest peak is designated as BPH41 (LOD = 12.30), and the second peak is designated as BPH42 (LOD = 11.08). (b,c) Effect plots of markers SWRm_01636 and SWRm_00328. These markers are located closest to the peak for BPH41 and BPH42, respectively. AA, AB and BB represent homozygous susceptible, heterozygous and homozygous resistant genotype, respectively. The BPH resistance scores on the y-axis are the mean resistance score for each genotype (mean ± s.e; n = 232).

