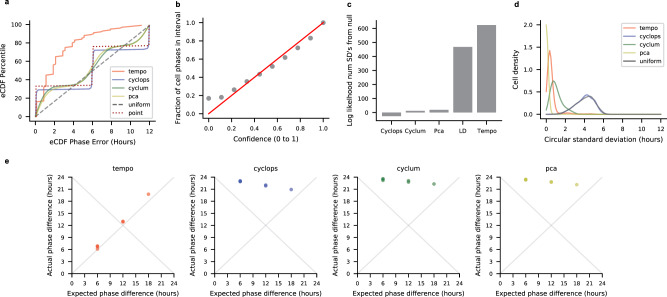
Fig. 5. Method results (considering all genes as input) on light-dark cycle aorta smooth muscle cells.
Treating the sample collection phase in the light-dark cycle as the true cell circadian phases: a eCDF of the errors for each method’s cell phase point estimates, b Calibration of Tempo’s uncertainty estimates. c Method out of sample core clock gene likelihood analysis. LD corresponds to treating sample collection times as the true cell phases. Out of sample core clock likelihoods were computed for each method, and reported in terms of standard deviations from the median of a distribution of likelihoods associated with phase assignments drawn from a random uniform distribution. d Method stability analysis. Each methods was run five times on the dataset. The circular standard deviation of predictions for each cell was computed and visualized as a distribution. e Method relative shift analysis. Each dot represents a pair of sample collection times in the light-dark cycle (e.g., all six possible pairs of ZT0, ZT6, ZT12, ZT18), and conveys the relationship between the expected phase difference between a pair of time points and the actual phase difference for each method. As the phase difference is a circular random variable, methods with points lying along either y = x or y = 24 − x denote perfect performance. Source data are provided as a Source Data file.

