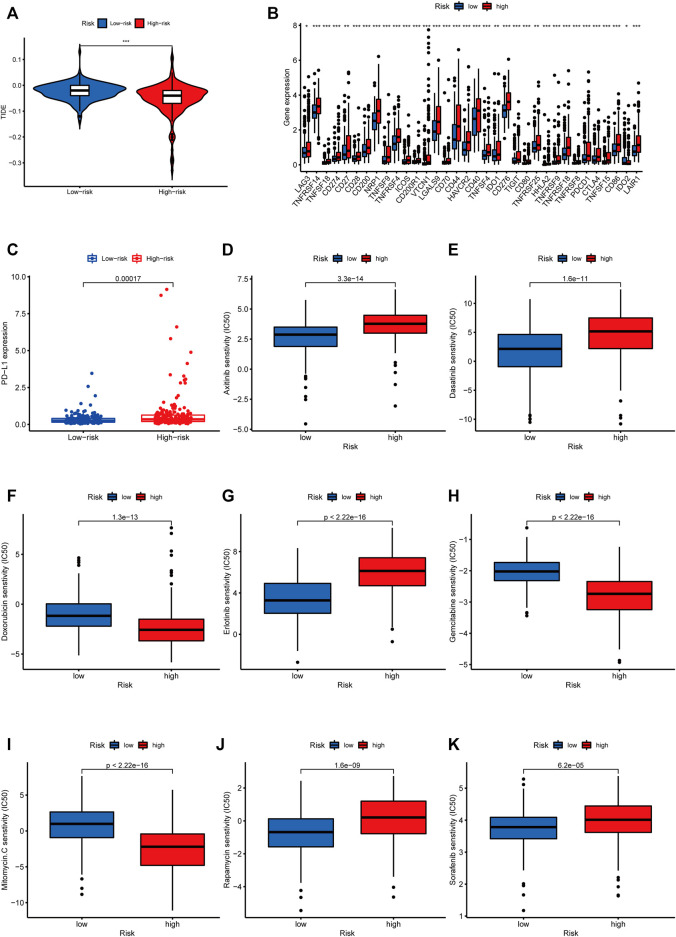
FIGURE 10.
Analysis of immunotherapy and chemotherapy responses based on m5C-related lncRNAs risk model. (A) Comparison of TIDE scores between the high-risk and low-risk groups. (B) The difference of 34 immune checkpoints expression level between high- and low-risk groups shown in the box plot. (C) Differences in PD-L1 expression between high- and low-risk groups. IC50 of axitinib (D), dasatinib (E), doxorubicin (F), erlotinib (G), gemcitabine (H), mitomycin.C (I), rapamycin (J), and sorafenib (K) in high- and low-risk groups.

