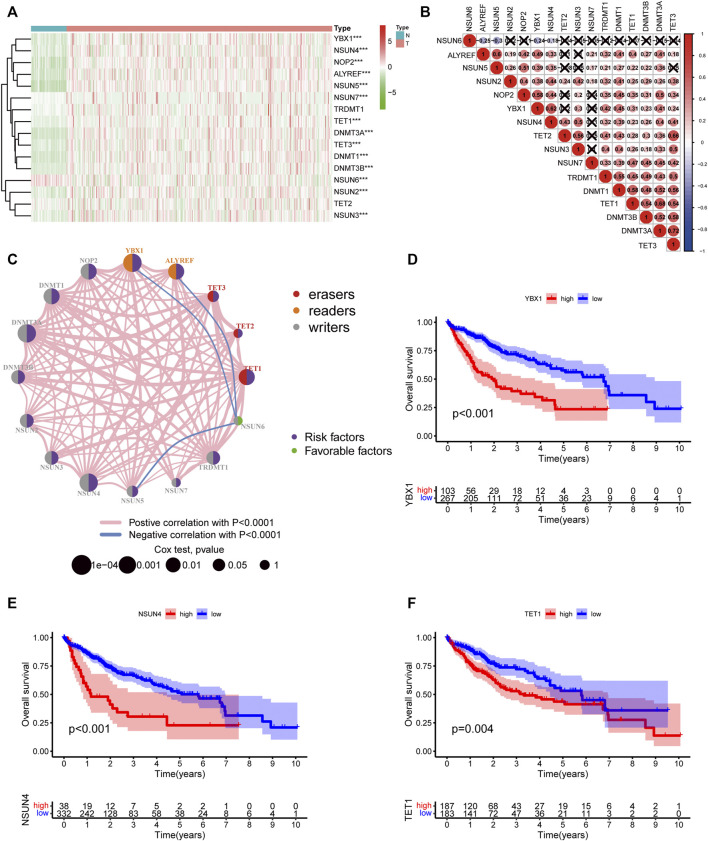
FIGURE 2.
The landscape of expression and prognosis of m5C regulators in HCC patients. (A) Heatmap displaying different expressions of m5C regulators in HCC. (B) Spearman correlation analysis of 16 m5C regulators. (C) The interaction between m5C regulators in HCC. The size of the circle represented the influence of each regulator on prognosis, and the range of values calculated by log-rank test was p < 0.0001, p < 0.001, p < 0.01, p < 0.05, and p < 1. Purple in the right part of the circle indicates risk survival factors and green in the right part of the circle indicates favorable survival factors. The types of m5C regulators are labeled as different colors in the left part of the circle. The thickness of lines shows correlation strength. Positive correlation is shown in pink and negative correlation in blue. (D–F) Overall survival analysis based on three m5C regulators’ expression in HCC.

