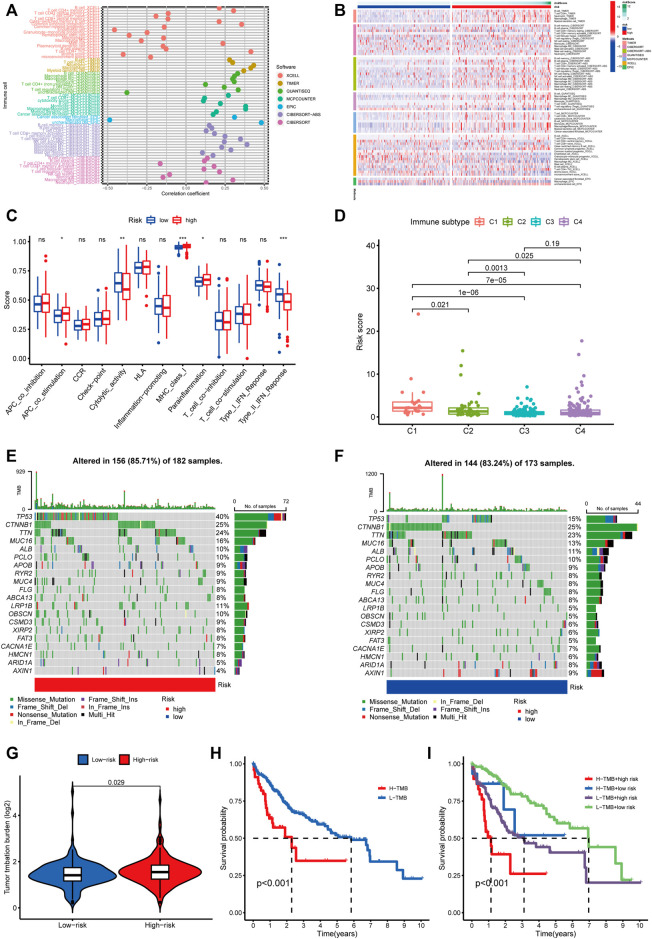
FIGURE 9.
Estimating the correlation between m5C-related lncRNAs and immune infiltration and mutation analysis. (A) The correlation analysis of risk score and tumor-infiltrating immune cells by TIMER, XCELL, QUANTISEQ, MCPcounter, EPIC, CIBERSORT-ABS, and CIBERSORT software. (B) A heatmap indicating the differential immune responses between the high- and low-risk groups based on the above seven software. (C) The differential scores of 13 immune-related functions in high- and low-risk groups. (D) Comparison of the risk score in different immune infiltration subtypes. *p < 0.05, **p < 0.01, and ***p < 0.001; ns, non-significant. (E,F) Waterfall plot of the 20 top mutated genes with high mutation frequency in the high-risk group (E) and low-risk group. (F,G) The different mutation event between two groups. (H) KM analysis between high/low TMB groups. (I) Comparative analysis of prognosis combining risk score and TMB.

