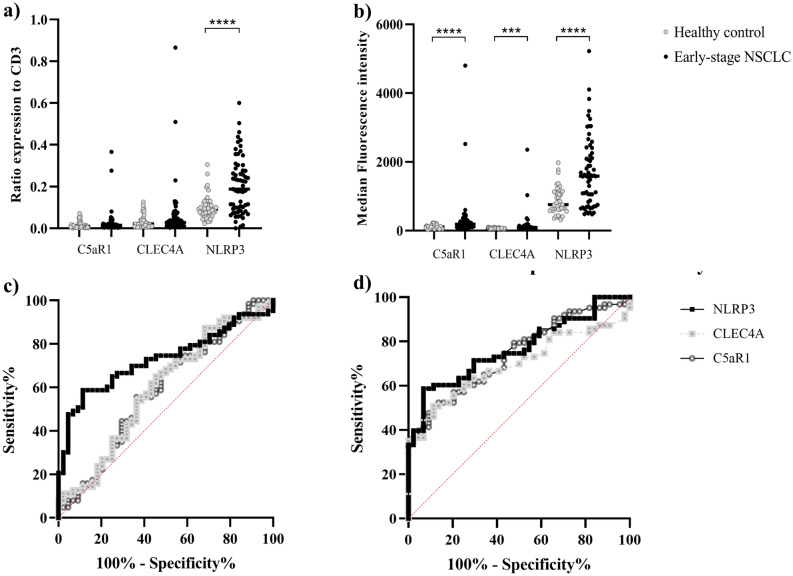
Figure 1.
Represented the ratios (a), median fluorescence intensity (MFI) (b) and adjusted expression (c) of C5AR1, CLEC4A and NLRP3 to CD3+ lymphocytes between healthy controls (n = 44) and early-stage NSCLC patients (n = 63). The ROC curve of C5AR1, CLEC4A and NLRP3 ratio and MFI between healthy controls and early-stage NSCLC patient (c,d). The CD3+NLRP3+ MFI provided the most distinguishable between early-stage NSCLC and healthy volunteer at 71.5% sensitivity and 70% specificity.

