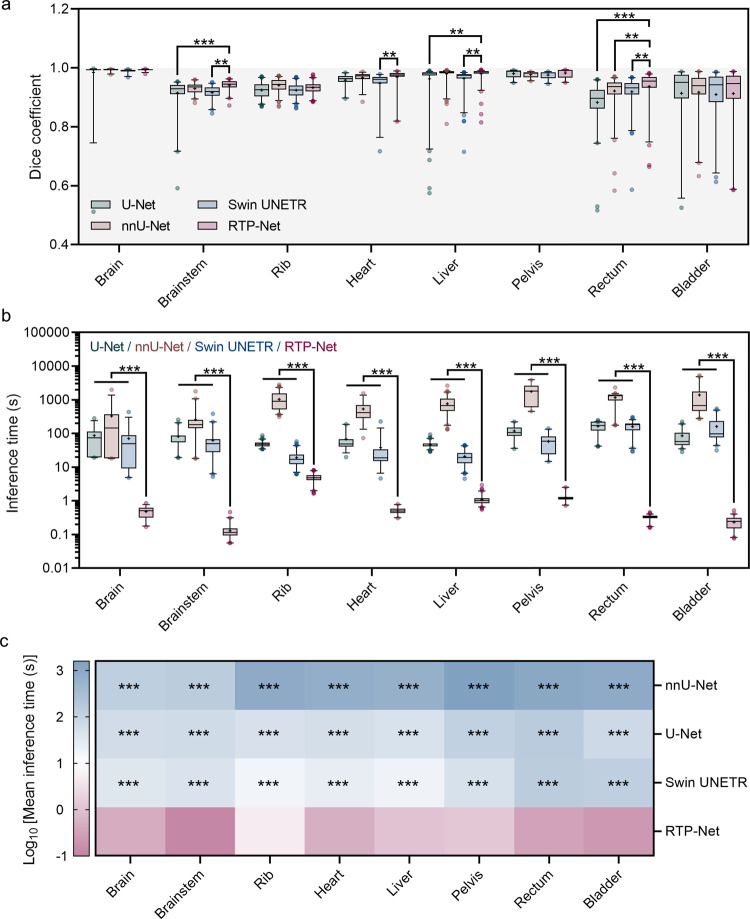
Fig. 5. Quantitative comparison of segmentation performance of four methods in terms of Dice coefficient and inference time.
a Dice coefficients of eight segmentation tasks by our proposed RTP-Net, U-Net, nnU-Net, and Swin UNETR. b Mean inference times in segmenting eight OARs by four methods. Both Dice coefficients (a) and inference times (b) are shown in box-and-whisker plots. The first quartile forms the bottom and the third quartile forms the top of the box, in which the line and the plus sign represent the median and the mean values, respectively. The whiskers range from 2.5th to 97.5th percentile, and points below and above the whiskers are drawn as individual dots. The number of eight organs can be referred to Supplementary Fig. 1. Statistical analyses in (a) and (b) are performed using two-way ANOVA followed by Dunnett’s multiple comparisons tests. Asterisk represents two-tailed adjusted p value, with * indicating p < 0.05, ** indicating p < 0.01, and *** indicating p < 0.001. The p values of Dice coefficients in (a) between RTP-Net and other three methods (U-Net, nnU-Net, and Swin UNETR) are 0.596, 0.999, and 0.965 for brain segmentation, respectively; <0.001, 0.234, and 0.001 for brainstem segmentation, respectively; 0.206, 0.181, and 0.183 for rib segmentation, respectively; 0.367, 0.986, and 0.010 for heart segmentation, respectively; 0.002, 0.999, 0.003 for liver segmentation, respectively; 0.991, 0.900, and 0.803 for pelvic segmentation, respectively; <0.001, 0.010, and 0.003 for rectum segmentation, respectively; 0.999, 0.827, and 0.932 for bladder segmentation, respectively. All p values in (b) between RTP-Net and other three methods in eight organs are lower than 0.001. c The heat map of the mean inference times in multiple segmentation tasks. Asterisk represents two-tailed adjusted p value obtained in (b), with *** indicating p < 0.001, showing the statistical significance between RTP-Net and the other three methods.

