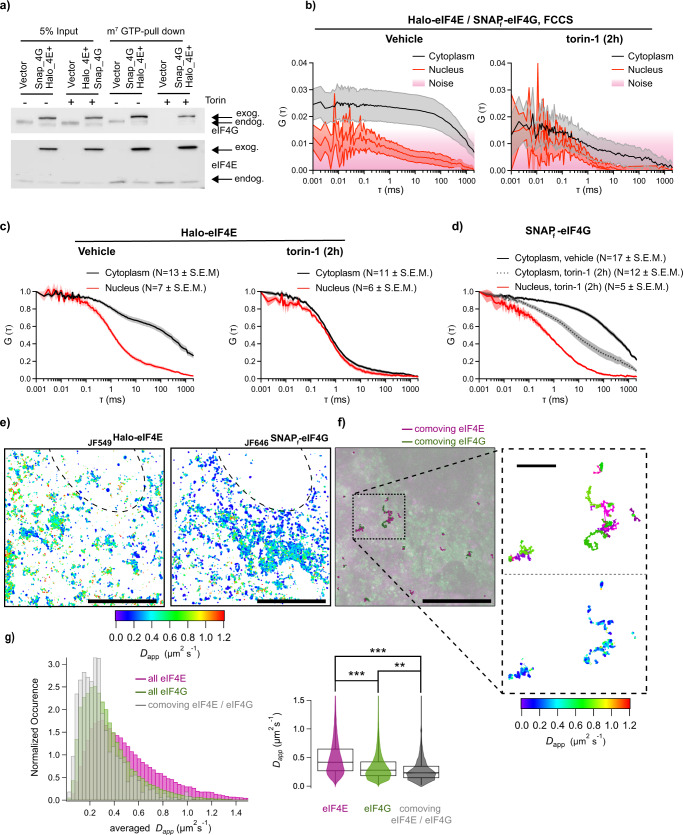
Fig. 4. eIF4E and eIF4G binding dynamics detected by FCS and SPT.
a NIH3T3 cells that express vector control or Halo-eIF4E and SNAPf-eIF4G were treated with DMSO (vehicle) or 250 nM torin-1 for 2 h. Total cell lysates (input) were subjected to cap-pull-down assay (m7GTP-pull-down) and analyzed by western blotting. eIF4G and eIF4E antibodies detected both endogenous (endog.) and exogenous (exog.) proteins as indicated by the arrows. b Simultaneous diffusion of JF585Halo-eIF4E and JF646SNAPf-eIF4G analyzed by dual-color fluorescent cross-correlation spectroscopy (FCCS) in cell treated with vehicle (left panel) or 250 nM torin-1 for 2 h (torin-1, right panel) in the cytoplasm (gray) and in the nucleus (red) (N = 10 ± SEM). Cross-correlation was detected in the cytoplasm of translating cells, but not in the nucleus, and abolished 2 h upon mTOR inhibition. c, d Individual JF585Halo-eIF4E (c) and JF646SNAPf-eIF4G (d) averaged autocorrelation curves from (b). e Simultaneous single-particle tracking of JF549Halo-eIF4E and JF646SNAPf-eIF4G was simultaneously recorded in the cytoplasm of an NIH3T3 (dotted line outlined the nucleus). Left: Diffusion properties of 4319 trajectories of JF549Halo-eIF4E and 4001 trajectories of JF646SNAPf-eIF4G are displayed via heat maps. Each point is false‐colored according to the mean square displacement calculated over all displacements originating in a circle (r = 80 nm). f Co-movement analysis of JF549Halo-eIF4E and JF646SNAPf-eIF4G. Maximum intensity projections of 5000 frames of JF549Halo-eIF4E (in magenta) and 5000 frames of JF646SNAPf-eIF4G (in green) were simultaneously acquired at 100 Hz. The co-moving JF549Halo-eIF4E (bold, magenta) and JF646SNAPf-eIF4G (bold, green) trajectories are displayed on top. Scale bar: 10 μm. Inset top: co-moving JF549Halo-eIF4E/JF646SNAPf-eIF4G trajectories with their associated diffusion heat maps displayed at higher magnification (scale bar: 1 μm). g (left) The distribution of apparent diffusion coefficients shifts to a slower population when JF549Halo-eIF4E is comoving with JF646SNAPf-eIF4G (in gray). (right) Violin plots of one-step mean square displacements for eIF4E (355,730, in magenta), for eIF4G (462,072, in green), and for co-moving eIF4E/eIF4G pairs (7947, in gray). Box quartile method: Tukey. The median line is shown, whisker method: min and max data. Two-sided t-test with two mean values of two distributions (*** means p < 0.001, ** means p < 0.01).

