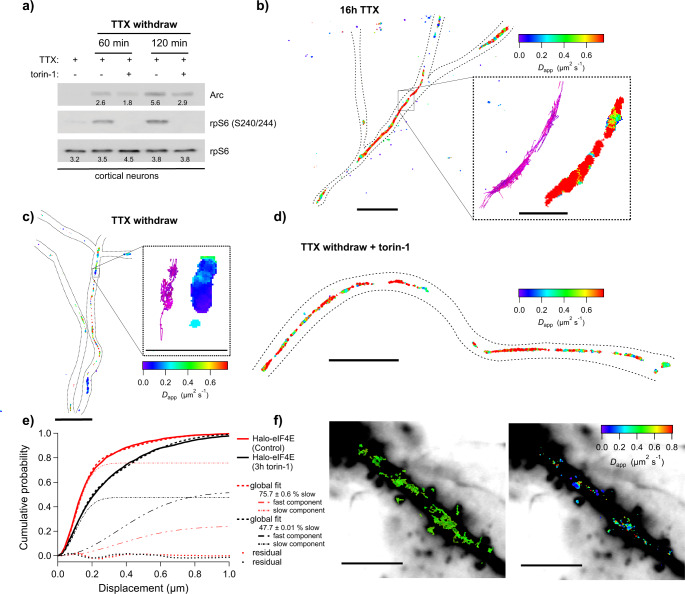
Fig. 5. Single-particle tracking of Halo-eIF4E in primary hippocampal neurons.
Rat hippocampal neurons were activated with TTX withdrawal with or without 250 nM torin-1. a Total cell lysates were analyzed by western blotting with the antibodies indicated next to the corresponding blot (n = 2). b Diffusion heat map of Halo-eIF4E trajectories obtained in inactivated neurons (16 h TTX) at a frame rate of 100 Hz (with a dotted neuronal outline, scale bar: 5 μm. Each point in the image is false‐colored according to the mean square displacement calculated over all displacements originating in a circle (r = 80 nm). Inset: Trajectories and corresponding diffusion heat map (scale bar: 1 μm). c Diffusion map of Halo-eIF4E of activated neurons after TTX withdrawal (scale bar: 5 μm). Inset: Trajectories and corresponding diffusion heat map (scale bar: 1 μm). d Diffusion speed of Halo-eIF4E in neurons treated with 250 nM torin-1 (red colors) (scale bar: 5 μm). e Single particle tracking was recorded at a frame rate of 200 Hz. The cumulative distribution function (CDF) of all single-molecule displacements for Halo-eIF4E is shifted to the left when compared to neurons treated with torin-1, which indicates a shift towards slower diffusion for Halo-eIF4E undergoing cap-dependent translation. CDF was obtained from 1226 and 742 trajectories in 10 individual dendrites of neurons treated with vehicle control or torin-1, respectively. The global two-component fit returns a global apparent Dslow of 0.32 ± 0.006 µm2/s and a global apparent Dfast of 4.10 ± 0.076 µm2/s. While the majority of control Halo-eIF4E exhibit slow diffusion (76 ± 0.6%), this percentage drops to 48 ± 0.6% when treated with torin-1. The data was recorded at 200 Hz, and we report apparent diffusion coefficients for that frame rate. f Left: Medium-intensity projection of 10,000 frames of JF549Halo-eIF4E recorded simultaneously with sparsely photo-activated PA-JF646Halo-eIF4E molecules (individual PA-JF646Halo-eIF4E trajectories are shown in green) at 56 Hz frame rate (scale bar: 10 μm). Right: The associated PA-JF646Halo-eIF4E diffusion heat map depicts that slow Halo-eIF4E molecules (in blue) linger near what appear to be spines in activated neurons (scale bar: 10 μm). Spines are indicated with an asterisk.

