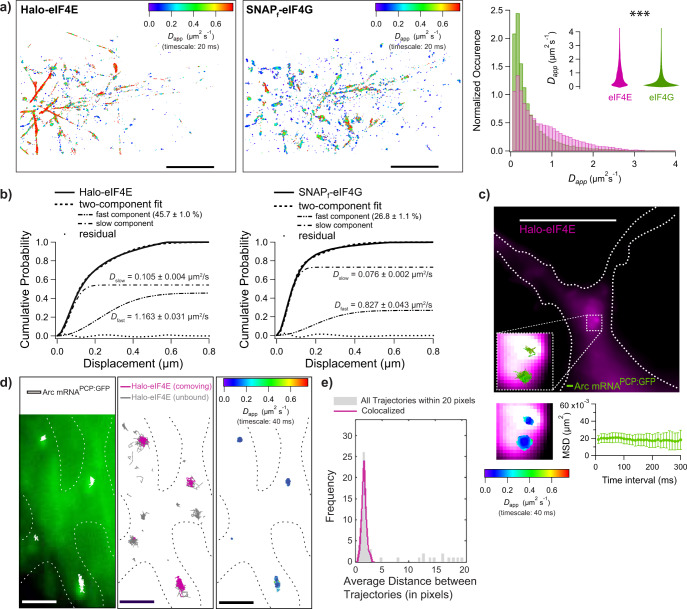
Fig. 6. Simultaneous single-particle tracking of endogenous Halo-eIF4E and SNAPf-eIF4G in mESC cells that were differentiated into neurons.
a Top left: Diffusion heat map of 18,220 JF585Halo-eIF4E trajectories from eight 10,000 frames 50 Hz movies obtained from a dense network consisting of more than 100 individual dendritic branches (scale bar: 10 μm). Top center: The corresponding heat map of the simultaneously recorded 26,438 JF646SNAPf-eIF4G trajectories. Top right: The distributions of apparent diffusion coefficients of JF585Halo-eIF4E (in green) and JF646SNAPf-eIF4G (in magenta). Two-sided t-test with two mean values of two distributions (*** means p < 0.001). b Cumulative distribution functions (CDF) were obtained from 26,438 eIF4G and 18,220 eIF4E trajectories. While the majority of Halo-eIF4E exhibit slow diffusion (54.3 ± 1.0%), this percentage increases to 73.2 ± 1.1% for SNAPf-eIF4G. c Thick dendritic process of a cortical neuron from ARCP/+;PCP-GFP;v-Glut2Cre mice expressing Halo-eIF4E after TTX withdrawal (dotted outline, scale bar: 10 μm). The median projection of the JF646Halo-eIF4E channel of 5000 frames was recorded at 100 Hz (in magenta). Overlay of two ARC mRNA trajectories (in green) labeled with PCP-GFP that were simultaneously recorded. 1.6 × 1.6 μm2 insets of JF646Halo-eIF4E and two ARC mRNA trajectories with their associated diffusion heat maps. The mean square displacement (MSD) curve of the two ARC mRNA trajectories depicts corralling of mRNAs and reveals an exploration area of 0.02 μm2. d Dendritic branches of cortical neurons from ARCP/P mice expressing Halo-eIF4E after TTX withdrawal (dotted outline, scale bar: 2 μm). Left: Median projection of the PCP-GFP channel of 6000 frames recorded at 100 Hz outlines a dense region of neuronal processes. Overlaid are the trajectories of four ARC mRNA molecules (in white). Middle: Co-moving Halo-eIF4E molecules (in magenta) and unbound Halo-eIF4E molecules are depicted in gray. Right: The diffusion heat map of co-moving mRNA/ Halo-eIF4E molecules depicts almost static movements of the translation factor interacting with ARC-mRNA. e The distribution of distances of all ARC-mRNA and all eIF4E particles (in gray) consists of a peak of short values (<4 pixels) above a flat baseline. The co-movement algorithm (magenta line) efficiently selects the peak of colocalized trajectories.

