
Figure 5.
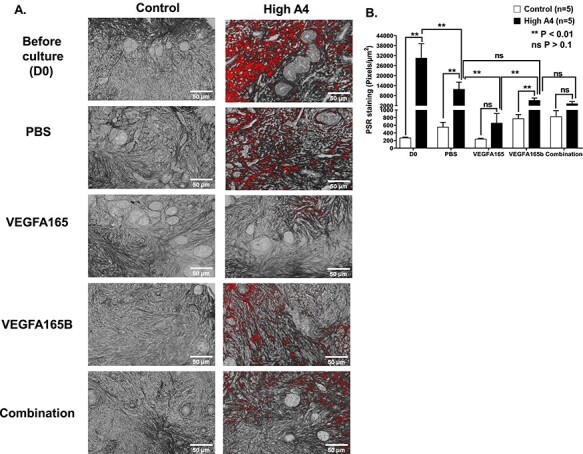
(A) Collagen staining (PSR) for High A4 and control ovarian cortexes before culture and after culture with different VEGFA isoforms in trial 2; (B) graph comparing the average area of PSR-positive staining per ovarian cortex field (pixels/μm2) between High and control cows before culture and after culture with different VEGFA isoforms. Statistical differences are denoted with **P < 0.01 or ns P > 0.10. n for control = 5; n for High A4 = 5.