
Figure 7.
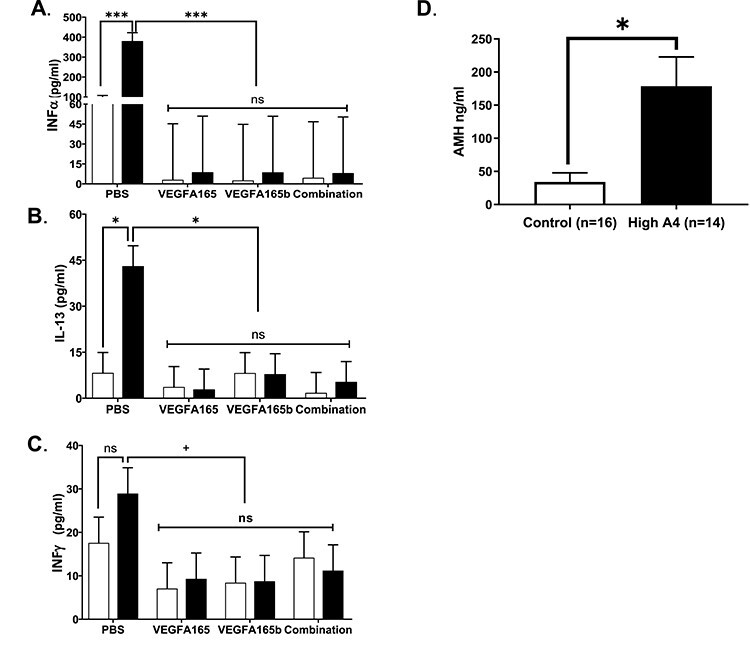
Effects of VEGFA isoforms on cytokines and chemokines in ovarian cortex culture media. Graphs representing PBS, VEGFA165, VEGFA165b, and combination treatments for (A) INFα, (B) IL-13, and (C) INFγ. (D) Concentrations of AMH in ovarian cortex cultures in trials 1 and 2. Control, n = 16; High A4, n = 14. Statistical differences are denoted on the graphs where P < 0.05 are different and P > 0.05 but <0.1 tend to be different.