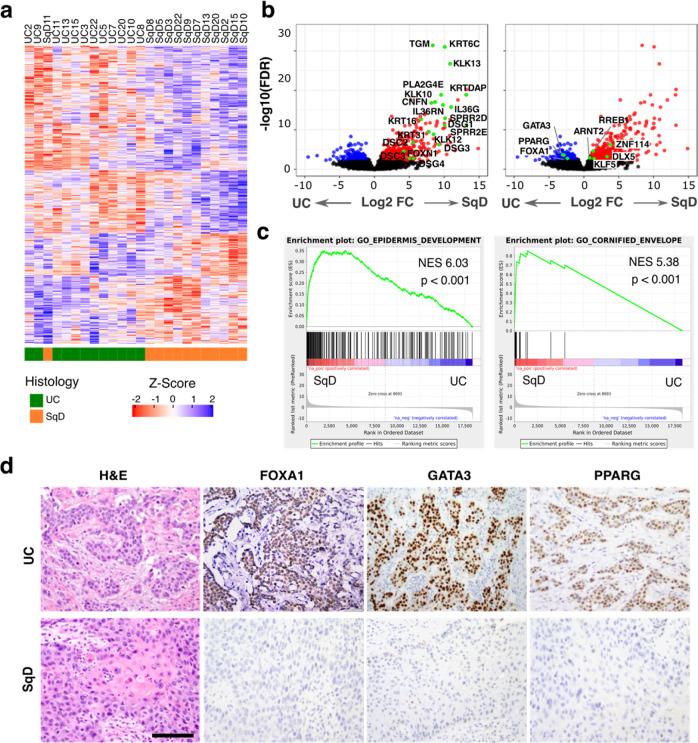
Fig. 3. SqD regions are characterized by loss of expression of the FOXA1, GATA3, and PPARG transcription factors.
a Differential gene expression analysis of RNAseq data from 12 biologically independent samples following macrodissection of paired UC and SqD regions revealed 718 significantly upregulated and 651 significantly downregulated genes in the SqD versus the UC regions (defined as log2 FoldChange >1 and FDR < 0.05). b Volcano plot of the same 12 UC-SqD pairs showing differentially expressed genes with log FoldChange on the x-axis and log p-value on the y-axis. Highlighted are genes associated with urothelial differentiation (left, blue color) or squamous differentiation during normal skin development (right, red color). c Gene Set Enrichment Analysis (GSEA) identified gene sets associated with epidermis development and the cornified envelope as the top gene sets upregulated in the SqD versus UC regions (two-sided paired Wilcoxon test). d Representative H&E and immunohistochemical stains showing loss of FOXA1, GATA3, and PPARɣ protein expression exclusive to the SqD regions of mixed histology tumors. Scale bar = 500 μm.

