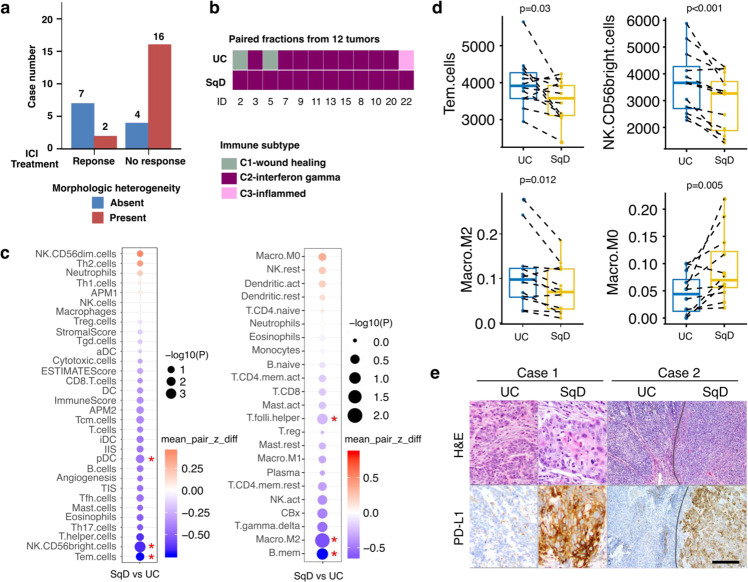
Fig. 4. Distinct immune response gene signatures in paired UC and SqD samples.
a Morphologic heterogeneity was associated with a lack of clinical benefit in bladder cancer patients treated with the anti-PD-L1 antibody atezolizumab (n = 29) (p = 0.01, Fisher’s exact test). b RNAseq data was used to classify the UC and SqD components from the 12 UC-SqD pairs based on TCGA immune subtypes. c Immune cell deconvolution analysis was performed using single sample Gene Set Enrichment analysis (ssGSEA, left) or the CIBERSORTX algorithm (right). The size of the circles is reflective of the p-value and the red * indicates significantly enriched immune cells in either the SqD or UC fractions (two-sided Paired sample Wilcoxon test). d Immune cell deconvolution scores for individual UC-SqD paired regions were plotted for significantly enriched immune cell types identified by either ssGSEA or CIBERSORTX. Analyses were performed on 12 biologically independent samples following macrodissection of paired UC and SqD regions. All analyses used paired sample Wilcoxon test. The line in the center of box plot denotes the median. The lower and upper bounds of the box indicate 1st and 3rd quartiles, respectively. The whisker reaches to the maximum and minimum point within the 1.5x interquartile range. Data beyond the end of the whiskers are outliers. e PD-L1 immunohistochemical analysis (clone SP263) of two representative tumors showing significantly higher PD-L1 expression in the SqD region versus the adjacent UC region (p = 0.02, Wilcoxon rank sum test, also Supplementary Table 1) of mixed histology tumors. Scale bar = 1 mm. Additional microscopic images from Case 2 taken at higher magnifications are included in Supplementary Fig. 13.

