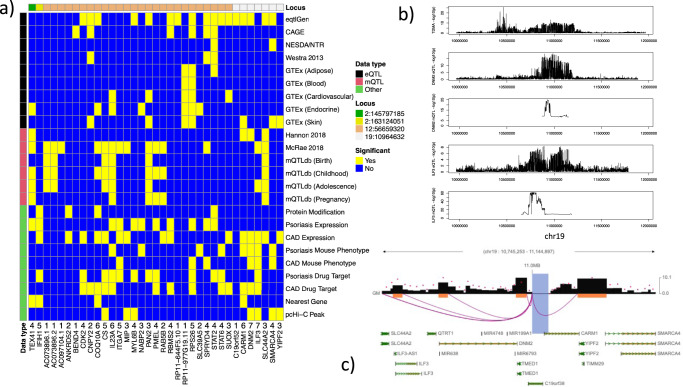
Fig. 3. Gene prioritization.
a Matrix of candidate genes by supporting evidence. Genes are included as candidates if one of the markers in the 95% Bayesian credible interval (BCI) set for each TDMA locus is a significant eQTL, mQTL or have a direct protein modification effect for that gene. Cells colored in yellow indicate genes with significant supporting evidence, while cells colored in blue do not. Sources of supporting evidence are grouped into three categories: eQTL (black), mQTL (red), and other (green). The color bar at the top of the matrix indicates the locus each gene belongs to (ordered by genomic position), with the position of the TMDA lead marker for each locus being indicated in the legend. The row of numbers, below the matrix and above the gene names, is a score, calculated by adding up the number of sources of evidence for that gene and counting the presence of any eQTL or mQTL only once, respectively, to avoid biasing towards these correlated data sources. b Regional association plots comparing TDMA genetic signals at the chromosome 19 locus with eQTL and mQTL signals (from eQTLGen and Hannon et al., respectively) for the two highest scoring genes (DNM2 and ILF3). c Promoter-capture Hi-C interactions for the chromosome 19 locus in lymphoblastoid cells. Shaded regions represent the extent of the interaction contacts. The region which encompasses the lead marker from TDMA interacts with promoters for DNM2 and ILF3.

