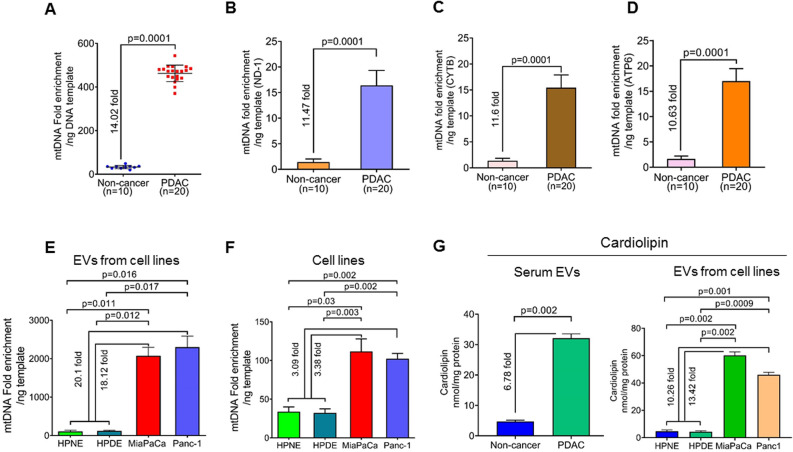
Figure 2.
Determination of mitochondrial DNA enrichment in the extracellular vesicles. (A) MtDNA was amplified by mitochondrial whole genome amplification using an equal amount of total DNA. Subsequently, DNA amount was measured, and fold enrichment of DNA content was calculated. The data is presented as a fold-difference of mean mtDNA enrichment values ± SD. (B–D) Real-time PCR analysis was performed for mitochondrial genes, ND-1, CYTB, and ATP6, using an equal amount of EVs DNA templates from each subject. (E) EVs were collected from the culture supernatant of non-tumorigenic pancreatic epithelial (HPNE and HPDE), pancreatic cancer cell lines (MiaPaCa and Panc-1), and total DNA from EVs were isolated. Fold enrichment of DNA content was calculated following mitochondrial whole genome amplification, and relative differences are presented. Fold changes were estimated by comparing the mean mtDNA enrichment in HPNE and HPDE with that of MiaPaCa and Panc-1. (F) Similarly, mtDNA enrichment was measured in total DNA isolated from these cell lines and fold changes were compared between the mean mtDNA enrichment in HPNE and HPDE with that of MiaPaCa and Panc-1. (G) Cardiolipin levels were measured in equal amount of EV derived from the serum of PDAC and non-cancer subjects and the culture supernatant of cultured cell lines. For the EVs from the cell lines, fold change is represented as comparison between mean cardiolipin level of EVs from HPNE and HPDE cells to that of MiaPaCa and Panc-1 cells.

