Figure 1.
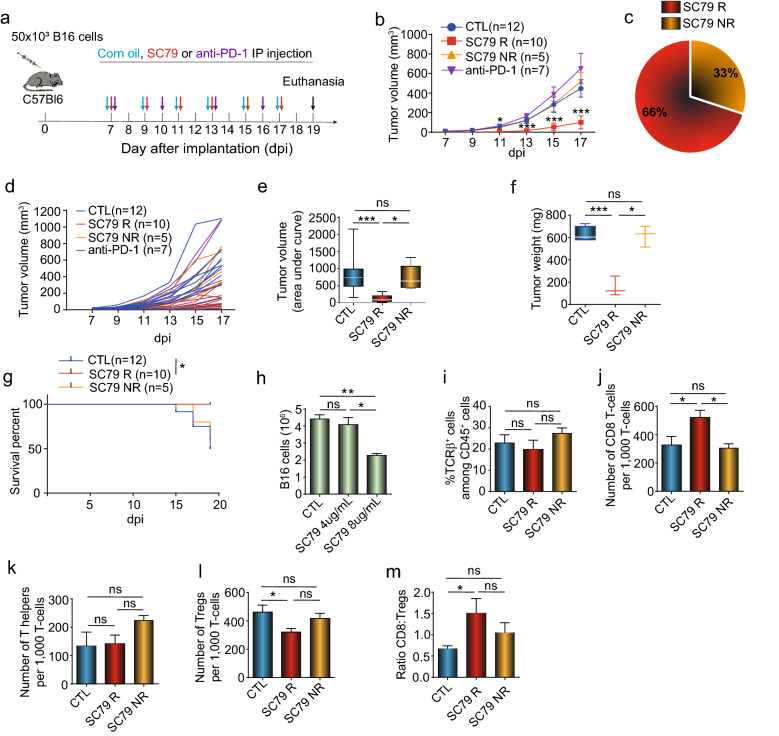
SC79 decreases anti-PD-1 resistant B16 tumor with an increase of the tumor infiltrated CD8-T-cell: Treg ratio: (a) Regime of treatment. (b) SC79 reduces B16 tumor growth. Control group (CTL,12), SC79 responder (SC79 R; 10), SC79 no responder (SC79 NR,5) and anti-PD-1 treated mice (anti-PD-1; 7). Data were pooled from 3 independent experiments (n = 3). (c) Proportion of the responder and non-responder mice to the SC79 treatment (n = 3). (d) Spider plots of SC79 reduction of B16 tumor growth (n = 3). (e) Histogram showing the tumor value using a measure (statistical area under the curve of the tumor growth for each group). (f) Tumor weight was measured on day 19 after implantation. Data show the representative result of three independent experiments (n = 3). (g) Survival curve. Mice were considered dead if dead or if the tumor size exceeded 1500 mm3 (which then required culling of mice) (n = 3). (h) Survival of B16 cells in in vitro culture with SC79 (n = 3). (i) Frequency of TCRβ+ T-cells within the CD45+ TIL population. (j) Number of CD8+ TILs is increased in responder but not in non-responder tumors (n = 5). (k) Number of CD4+ FoxP3− TILs in control, responder and non-responder tumors (n = 5). (I) Number of CD4+FoxP3+ Treg TILs is decreased in responder but not in non-responder tumors (n = 5). (m) CD8 T-cell to Treg ratio in TILs. CD8+ TILs increased in responder but not in non-responder tumors (n = 5). Results from panels i to m were obtained from 5 control tumors, 4 SC79 responder tumors and 3 SC79 non-responder tumors. For statistical analyses, parametric unpaired t-test on the area under the curve from each mouse, Mantel-cox test and one-way ANOVA were used. *p < 0.05, ***p < 0.001.

