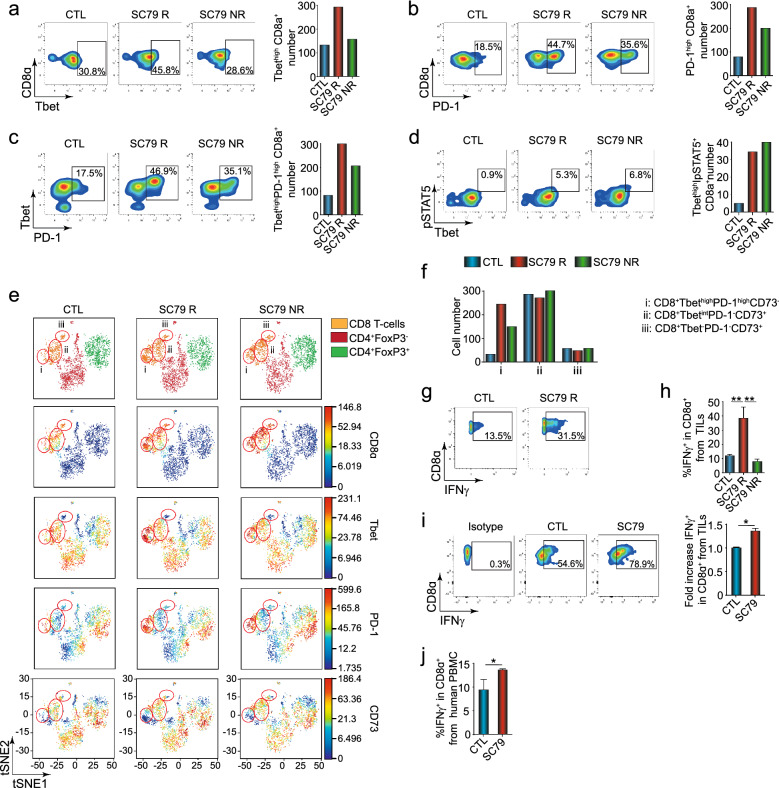
Figure 4.
SC79 increases tumor infiltration of CD8-T cells and CD8 T-cells expressing IFNγ. (a) Profiles showing an increase in the per cent of CD8alpha x Tbet expression in responsive mice (left panel). Histogram showing an increase in numbers of CD8alpha x Tbet TILs responder mice (right panel) (n = 3). (b) Profiles show an increase in the per cent of CD8alpha x PD-1 expression (left panel). Histogram showing the increase in numbers of CD8alpha x PD-1 TILs (right panel) (n = 3). (c) FACS profiles show an increase in the per cent of Tbet x PD-1 expression (left panel). Histogram showing the increase in numbers of Tbet x PD-1 TILs (right panel). (d) Profiles showing an increase in the per cent of pSTAT5 x Tbet expression (left panel). Histogram showing the increase in numbers of pSTAT5 x Tbet 1 TILs (right panel) (n = 3). (e) viSNE analysis of TILs with a focus on CD8+ T-cells (circled). Subpopulations of CD8 T-cells were obtained by the expression of Tbet, PD-1, and CD73 (n = 3). (f) Histogram showing the frequency and cell number of CD8 T-cell subpopulations outlined in Fig. 2e. (g) Profiles showing the frequency of CD8 T-cell TILs expressing IFN-γ. (h) Histogram showing the increase in the percentage of CD8 T-cells expressing IFN-γ from CTL (n = 4), SC79 R (n = 3) and SC79 NR (n = 3) mice. An increase in CD8+ IFN-γ+ TILs was seen in responder but not non-responder mice. i, IFN-γ expression on CD8 T-cells is increased by treating ex vivo TILs with SC79 from control mice. TILs from untreated mice were cultivated in a 96-well plate for 3 days with anti-CD3 with recombinant IL-2 in the presence or absence of SC79. While 54.6 per cent of CD8+ control cells showed IFN-γ expression, this increased further to 78.9 per cent due to culturing in SC79 (n = 3). j, IFN-γ expression in CD8 T-cell from a healthy donor after 48 h of culture with or without SC79 (n = 4). Results from the figure (a) to (g) were obtained after CyTOF acquisition from a pool of 3 tumors of each group. For statistical analyses, one-way ANOVA and a non-parametric unpaired t-test were used. *p < 0.05, **p < 0.01. The R package CATALYST v1.12.1 was used to perform unsupervised clustering, and generate the heatmaps and tSNE plots. https://bioconductor.org/packages/release/bioc/html/CATALYST.html. https://f1000research.com/articles/6-748.

