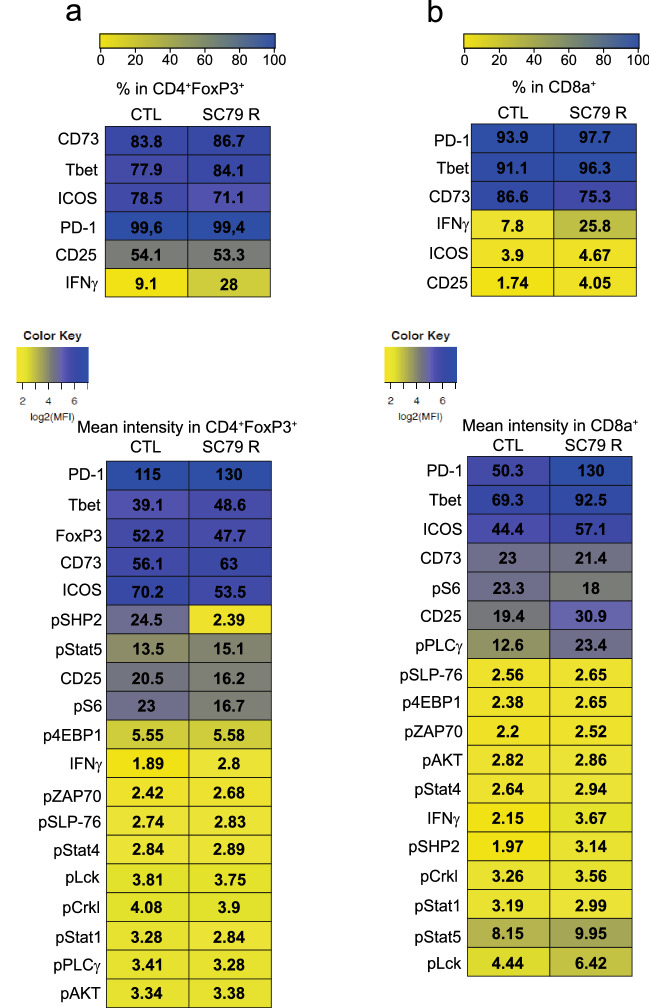
Figure 5.
CyTOF analysis shows phosphorylation AKT mediated signalling events in different TIL subsets. (a) Patterns in CD4+FoxP3 TILs (n = 3). Upper panel: % representation in CD4+FoxP3+ subset. lower panel: MFI representation in CD4+FoxP3+ subset (* denotes noteworthy changes). CD4+ FoxP3−, CD4+FoxP3+ and CD8+ subsets showed quantitative similarities and differences in levels of different phospho-proteins. pSHP2 was expressed at the highest level in CD4+FoxP3+ Tregs where it underwent a striking tenfold decrease in response to SC79 therapy (from 24.5 to 2.39). (b) Patterns in CD8+ TILs. Upper panel: % representation in CD8+ subset. lower panel: MFI representation in CD8+ subset. * denotes noteworthy changes in pPLC-γ most affected in CD8+ T-cells where it increased from 12.6 to 23.4, an effect not seen in CD4+ FoxP3− or + T-cells. Results were obtained after CyTOF acquisition from a pool of 3 tumors of each group.Heat maps were generated with Morpheus, https://software.broadinstitute.org/morpheus The uploaded information was simply performed in order obtain a colored chart. There was no statistical analysis performed by the Morpheus site for this purpose. For this reason, no version number or name was provided by the website. The loaded data for colored chart formation was conducted on the website in March 2019. “The log2 values were obtained with CATALYST https://www.bioconductor.org/packages/devel/bioc/manuals/CATALYST/man/CATALYST.pdf”.

