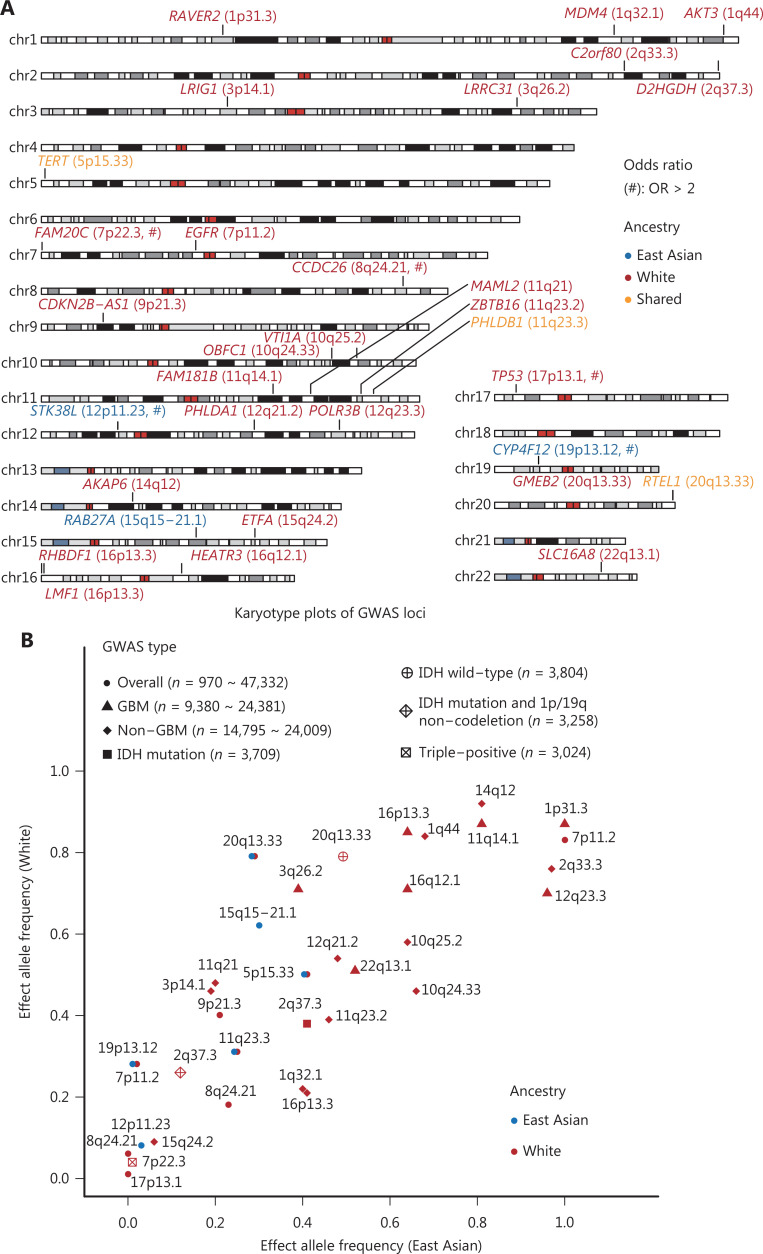
Figure 3.
Summary of GWAS-reported genetic loci associated with glioma risk. (A) Karyotype plot of reported GWAS SNPs for adult diffuse glioma. All GWAS-identified risk SNPs from both the East Asian and White groups are plotted and labeled with gene name and locus in corresponding genome positions. Blue and red indicate SNPs unique to East Asian and White populations, respectively. Orange indicates SNPs identified or validated in both races. SNPs with an odds ratio (OR) >2 are labeled with the symbol #. (B) GWAS type and corresponding SNPs, tagged with cytoband. All SNPs from different GWAS were plotted according to effect allele frequencies from East Asian and White populations; the shape represents GWAS type, and the color represents ancestry. The ranges of sample numbers of each type of GWAS study are shown.

