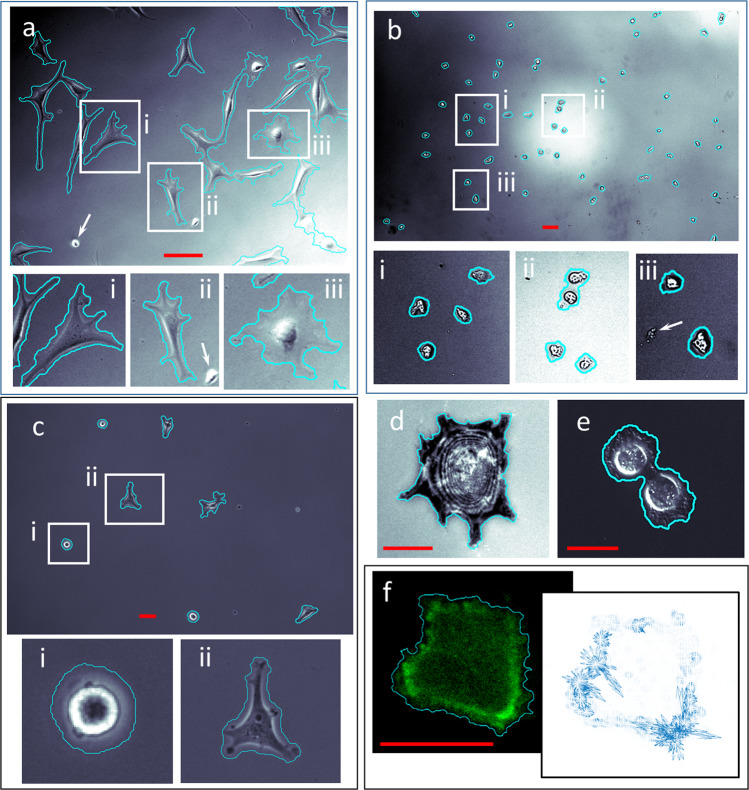
Fig. 3. Self-supervised segmentation for a range of cell types, microscope modalities, time resolutions and magnifications.
a phase contrast of Hs27 fibroblasts (10X objective, time increment: 1200 s) b transmitted light of Dictyostelium (10X objective, time increment: 60 s) c phase contrast of MDA-MB-231 (10X objective, time increment: 600 s) d IRM image of a single Hs27 cell (40X objective, time increment: 600 s). e DIC image of MDA-MB-231 cells (20X objective, time increment: 120 s) f fluorescence image of a single lifeAct (GFP-actin conjugate) transfected A549 cell (pseudo-colored) with the associated FD vector plot (100X objective, time increment: 10 s). Insets i, ii, iii highlight boxed image regions. White arrows point to examples of debris that was correctly labeled ‘background’ due either to lack of motion or automated size filtering. Images have been contrast enhanced to highlight low contrast features and background inhomogeneities. DIC image e was additionally enhanced with a sharpen filter to highlight interference induced shadowing of cell features. Scale bars: a, b, c: 50 µm; d, e: 25 µm; f: 10 µm.

