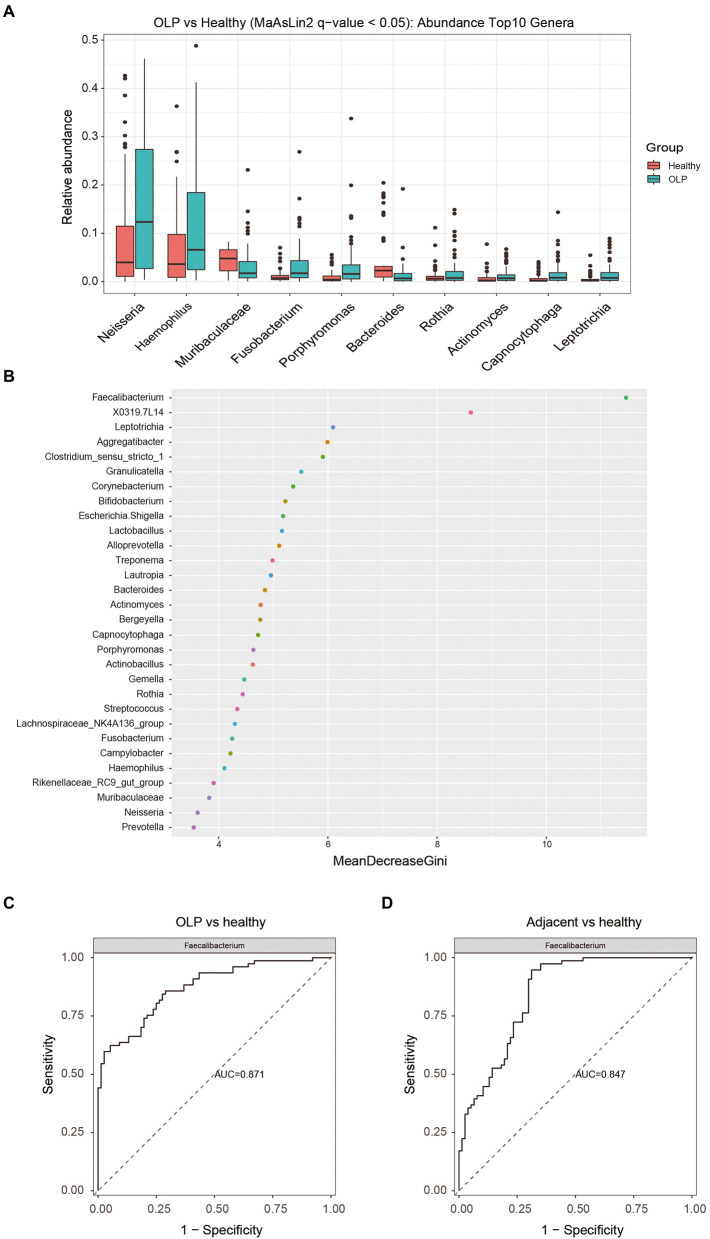
Figure 3.
Screening of differential species and analysis of their importance. (A) Top 10 different species at genus level among the three groups. The colors represent different groups, and the vertical axis represents log transitions of relative abundance of species. (B) Random forest analysis. The horizontal axis is the measure of importance, and the vertical axis shows the species in order of importance. (C) The ROC plots of Faecalibacterium (OLP vs healthy). (D) The ROC plots of Faecalibacterium (Adjacent vs healthy).

