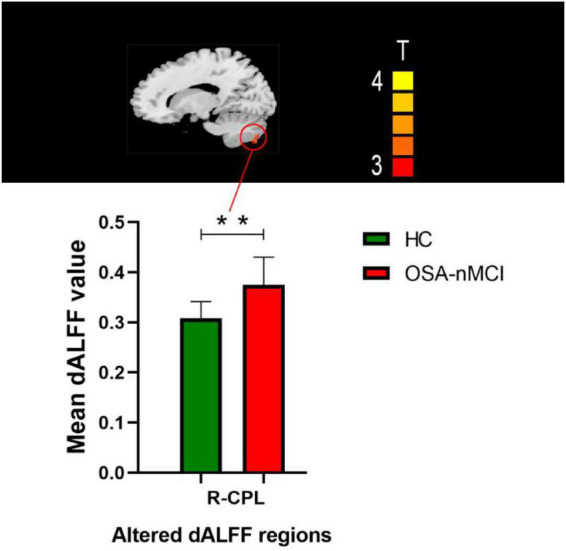
FIGURE 4.

Maps showing differences in dynamic amplitude of low-frequency fluctuation (dALFF) in the OSA without MCI (OSA-nMCI) with healthy control (HC) groups. Differences between the groups were calculated using post hoc analysis based on a two-sample T-test with the threshold set at voxel P < 0.05 and cluster P < 0.005 with GRF correction. ** means that there are significant difference between the groups.
