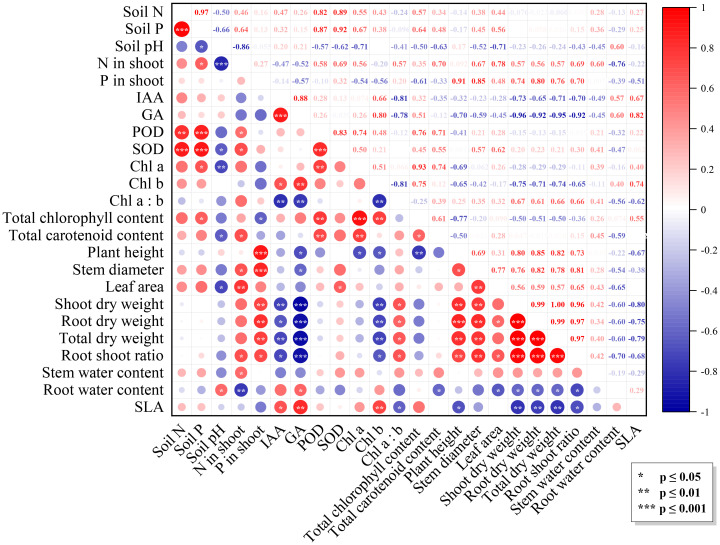
Figure 3.
Correlation matrix of the factors. The upper triangular part of the graph is the correlation coefficient matrix, the lower triangular part is the graphical indication, with the diameter of the dots denoting the values of the correlation coefficients: positive and negative correlations are indicated by colors, and significance levels are indicated by asterisks.

