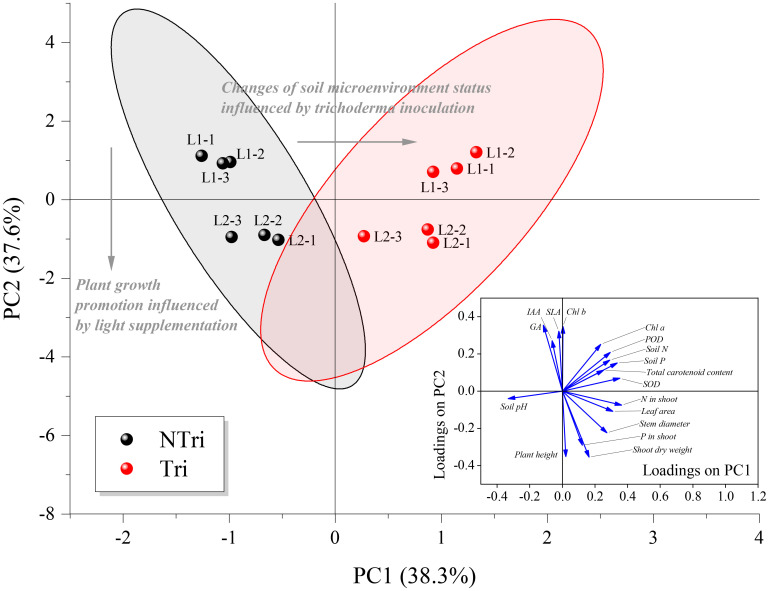
Figure 4.
Biplot of principal component analysis (PCA) for the factors. NTri and Tri denote the Non-Trichoderma inoculated and Trichoderma inoculated groups, respectively. L1 and L2 denote the treatment groups with the light intensity of 50 and 150 μmol·m-2·s-1, respectively. Blue arrows denote the loadings, which are the coefficients of the linear combination of the factors that constitute the PCs. The gray arrows denote the principal influencing processes characterized by the sample scatter distribution. Samples of each treatment group are clustered and enveloped in their respective 95% confidence ellipse.

