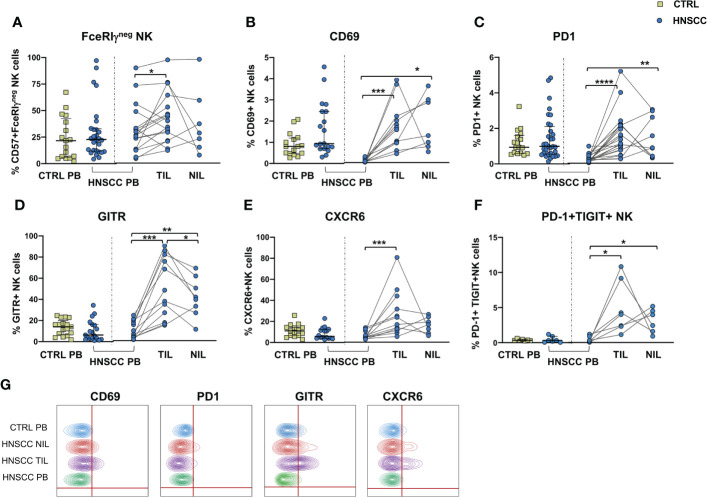
Figure 2.
(A) Frequency of FcϵRIγ negative CD56+/CD57+ adaptive NK cells in PBMC from control subjects (CTRL PB), and from HNSCC patients (HNSCC-PB) as well as matched tumor-infiltrating lymphocytes (TIL) and surrounding non-tumor-infiltrating lymphocytes (NIL). Percentage of NK cells expressing (B) CD69, (C) PD-1 (D) GITR and (E) CXCR6. (F) Frequency of PD-1+TIGIT+ NK cells. (G) Representative concatenated flow cytometry plots showing the percentage of expression of the indicated phenotypic markers on CD3-CD56+ NK cells. The Mann–Whitney U test was used to compare CTRL and HNSCC subjects. Paired data were analyzed by the Wilcoxon signed rank test. *p < 0.05, **p < 0.01, ***p < 0.001, ****p < 0.0001.

