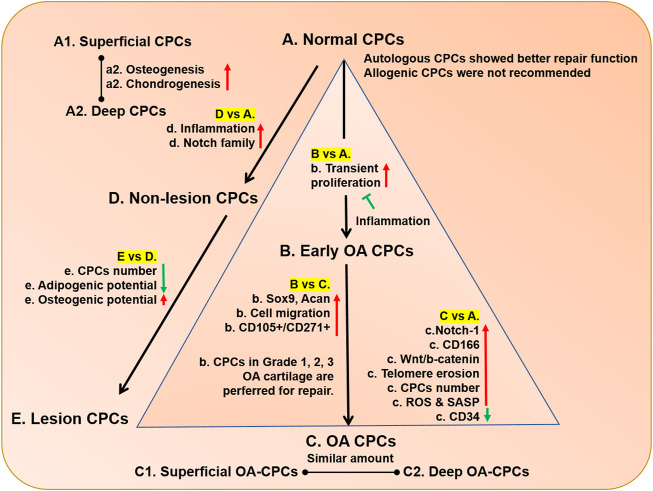
FIGURE 4.
The comparison of CPCs in normal and OA cartilage. The CPCs in normal, early OA, and late OA cartilage were compared, while the CPCs in normal, non-lesion, and lesion OA cartilage were compared. The capitalized (A–E) means CPCs from healthy cartilage, early OA CPCs, OA CPCs, CPCs from non-lesion OA cartilage, CPCs from lesion OA cartilage, respectively. a, b, c, d, e, f, g in lowercase means the cell properties in A, B, C, D, E cells compared with cells being connected by line, respectively. The red arrow means upregulation; the green arrow means downregulation. The blue symbol means inhibition.

