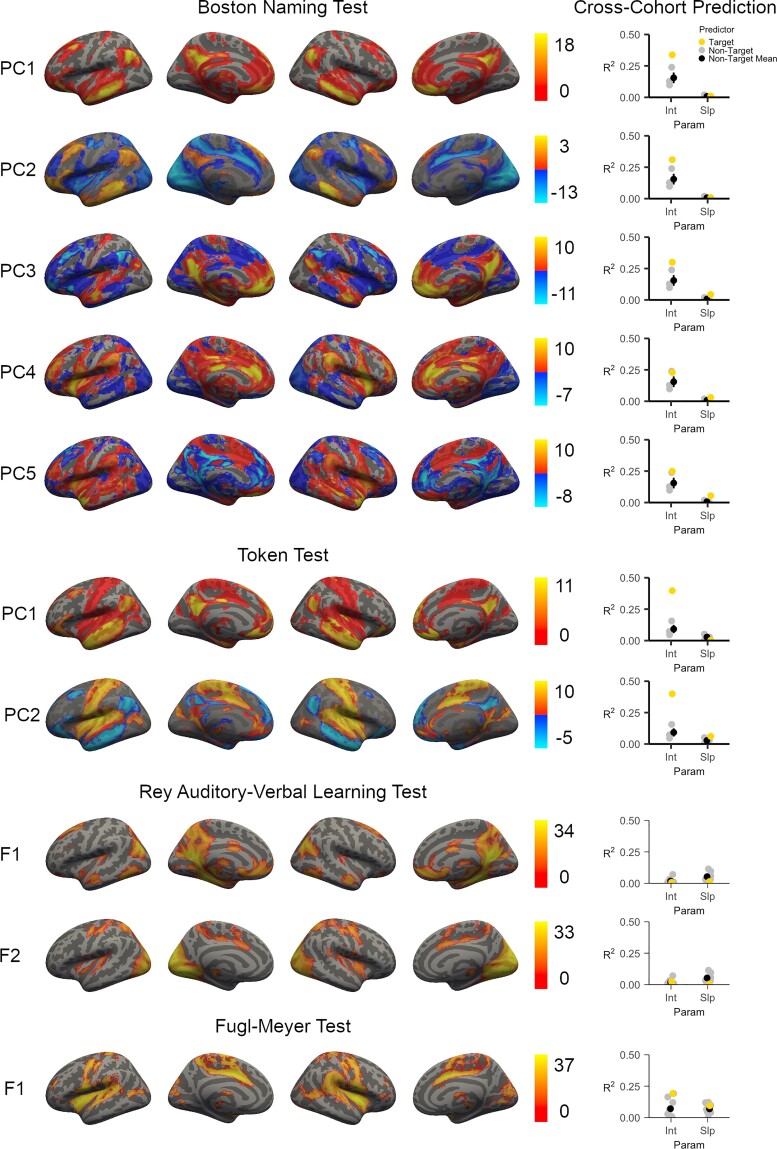
Figure 4.
Functional lesion network mapping. Grey matter seeds were derived from the LBMs of each domain and submitted as seed regions-of-interest for lesion network mapping analyses. Results based on the LBM of the Boston Naming Test and the Token Test were reduced using PCA, which describes major axes of variation across the individual functional lesion network maps. Principal component maps are ordered in terms of the amount of variance they captured across the individual functional lesion networks maps (F). Principal components with positive and negative voxels indicate that the distinction between the positive and negative voxels captures a distinction present across the maps. Five principal components were identified for the functional networks linked to performance on the Boston Naming Test, with most results converging on a fronto-parieto-temporal network (PC1). Two principal components were linked to the Token Test, and these seeds also converged primarily on a fronto-parieto-temporal network (PC1). Results based on the delayed recall trial from the Rey Auditory Verbal Learning Test identified only two networks: a lateral occipital-precuneate network, and a network spanning primary and secondary visual cortices. The results based on the Fugl-Meyer Test were linked to a single rolandic-insular-opercular functional network. Colour scales for the PC maps indicate the principal component score at each voxel; otherwise, colour scales represent the Z-value associated with the statistical test of functional connectivity at each voxel. The ability of each map to predict variance (R2) in the corresponding behavioural test’s latent growth curve intercept (Int) for the WU cohort is presented alongside each map. We also present the average variance explained in each corresponding WU cohort test when predicted from the non-target functional LNM maps (i.e. the functional LNM maps and/or PC functional LNM maps from the other behavioural domains). Error bars represent standard error. Int = Intercept for the WU Cohort Latent Growth Curve Model; Param = Type of WU Cohort Latent Growth Curve Parameter; Slp = Slope for the WU Cohort Latent Growth Curve Model.

