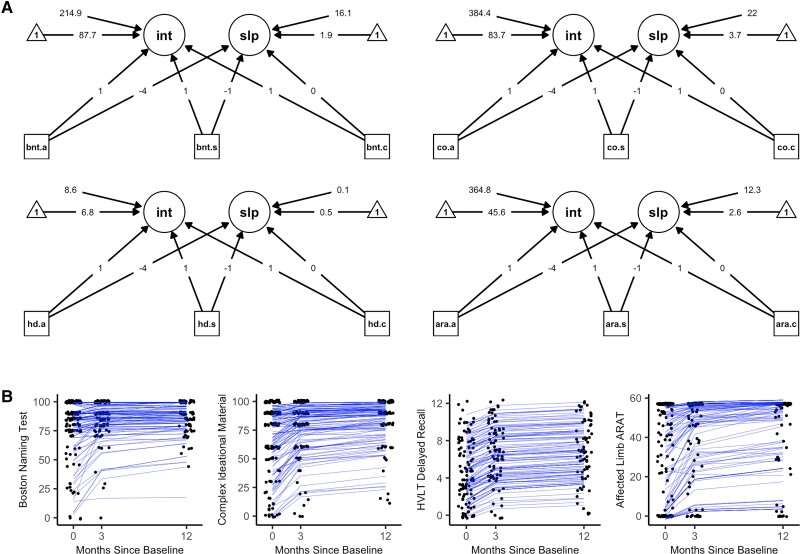
Figure 5.
Latent growth curve models. (A) The path diagrams for the latent growth curve models. (B) A depiction of the individual-level latent growth curves using jittered data-points and blue subject-specific growth curves (i.e. model-based recovery trajectories), each with their own intercept at 12-months post-baseline and their own slope of recovery that vary around the mean of the latent intercept (int) and slope (slp) variables. Missing data due to participant attrition at the 3- and 12-month measurements were imputed using Full Information Maximum Likelihood. Arrow from observed variables (squares) to latent variables (circles) represent loadings specified from the Latent Growth Curve analyses. Loadings onto the slope were determined through comparisons of model fit to the data for linear and quadratic modeled change over time. Loadings onto the intercept were all set to one, as is standard in Latent Growth Curve analyses. Arrows from triangles represent the mean of the latent variables. Arrows from free floating numbers to the latent variables represent the variance of the latent variables. Model fit to the observed data is presented in Supplementary Table 2. .a = Acute Measurement; ara = Action Research Arm Test; bnt = Boston Naming Test; .c = Chronic Measurement; co = Complex Ideational Material Test; hd = Hopkins Verbal Learning Test Delayed Recall Trial; int = Lateng Growth Curve Intercept (12-month time point); .s = Subacute Measurement; slp = Latent Growth Curve Slope.

