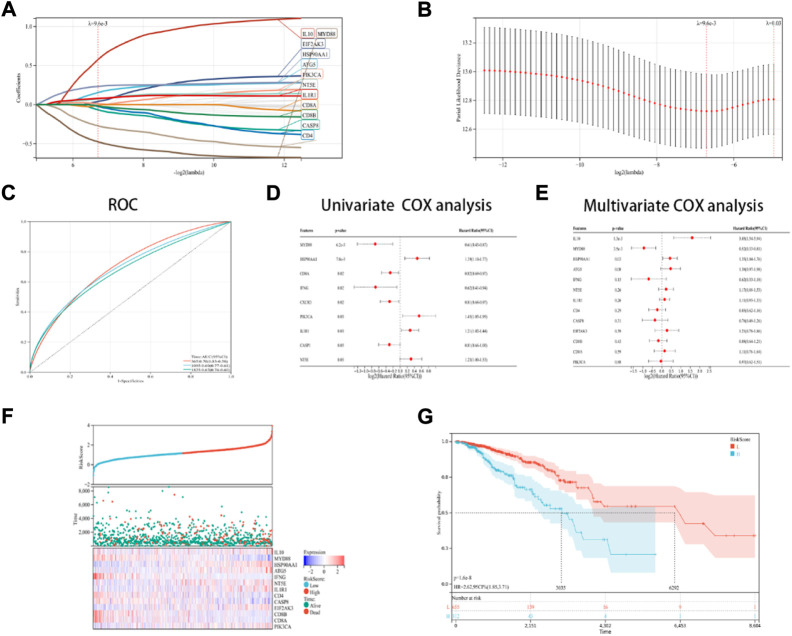
FIGURE 5.
Designing and validating the ICD risk signature. (A,B) Lasso Cox regression analysis was used to identify 13 genes in the TCGA dataset that were strongly associated with OS; (C) ROC curves with the AUC values; (D,E) Univariate and multivariate Cox regression analyses were performed for assessing the prognostic values of the ICD genes, with regards to OS; (F) Risk score distribution, OS status of every patient, and the heatmaps depicting the prognostic application of the 13-gene signature; and (G) KM curves of the patient’s OS in the high-risk cohort and low-risk cohort subcategories.

