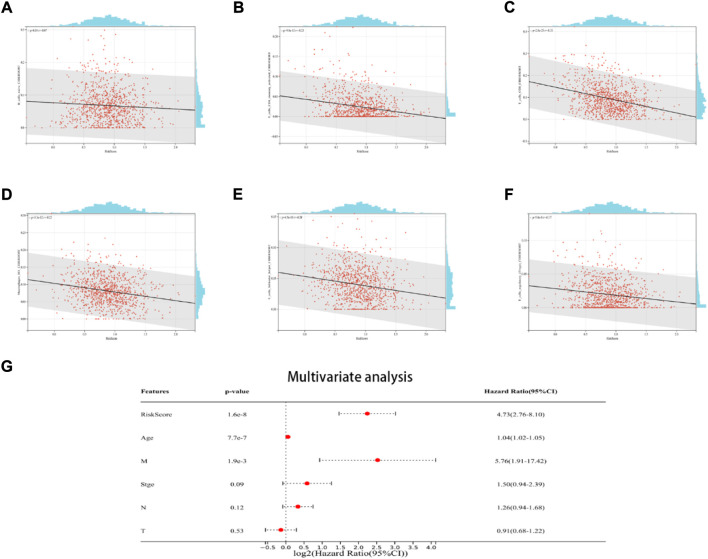
FIGURE 6.
The relationship between the TME and ICD risk signature. Scatter plots in (A–F) illustrate the relationship between risk score and the infiltration status of activated CD4 memory cells, native B cells, CD8 cells, helper follicular T cells, M1 macrophages, and regulatory (Tregs) T cells; (G): Multivariate Cox regression analysis assess the prognostic value of the ICD risk signature in BRCA patients in an independent manner.

