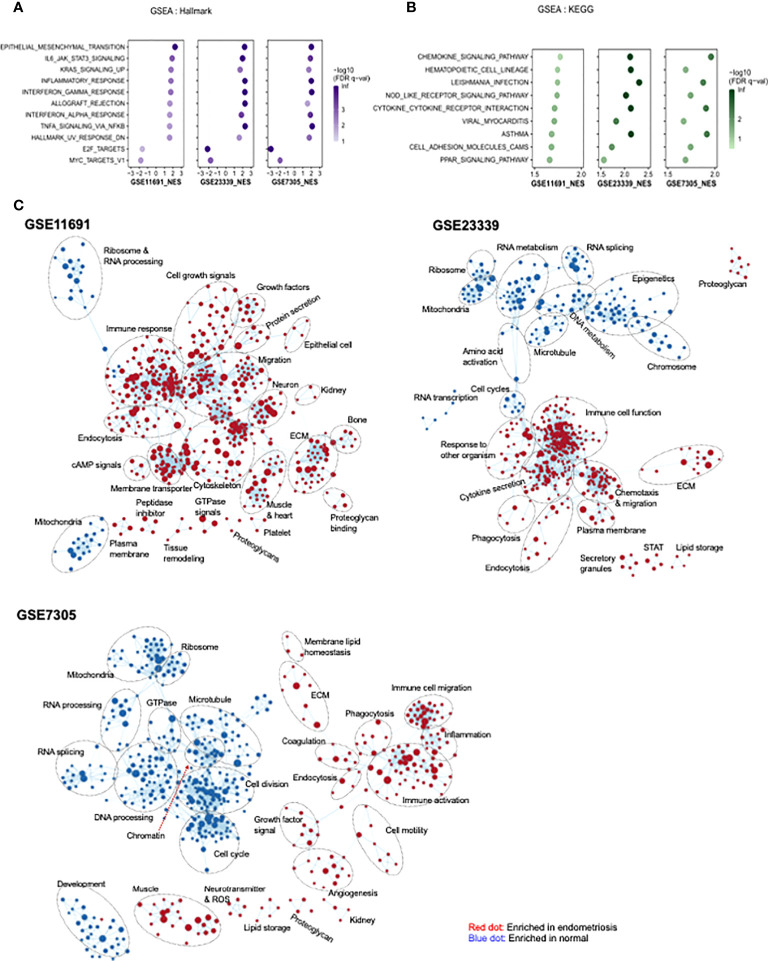
Figure 4.
Identification of pathway networks by GSEA. (A, B) Common pathway categories identified by GSEA with gene set database of Hallmark (A) and KEGG (B) are presented. (C) GSEA was performed to obtain enriched GO-terms and visualized using Enrichment Map plugin of Cytoscape. The size of each node indicates the size of gene set. Red and blue indicate the node enriched in endometriosis and normal tissue, respectively.

