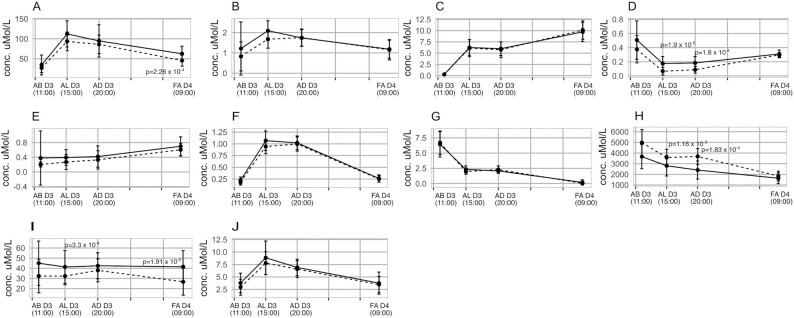
FIGURE 2.
Comparison of serum short-chain fatty acid concentrations through the day for the same time points for the healthy and unhealthy diets. Values are shown as median and IQR; n = 19. The healthy and unhealthy diets are represented by solid and dashed lines, respectively. Differences between the same time points for different diets were determined by Wilcoxon signed-rank test and false discovery rate post hoc correction. Padj < 0.05 indicates statistical significance. (A) Acetic acid, (B) isobutyric acid, (C) butyric acid, (D) 2-methylbutyric acid, (E) isovaleric acid, (F) valeric acid, (G) caproic acid, (H) lactic acid, (I) 2-hydroxybutyric, and (J) propionic acid. AB D3, after breakfast on day 3; AD D3, after dinner on day 3; AL D3, after lunch on day 3; FA D4, fasting on day 4.

