Figure 7.
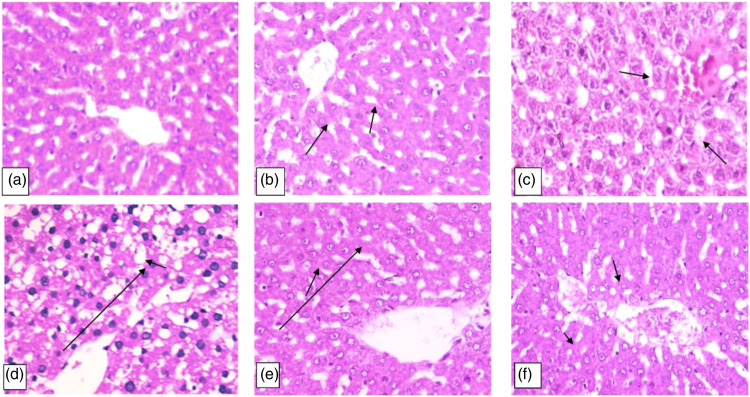
Photomicrograph of the hepatic tissue section. Figures (a and b) representing control and Lut/ZnO NPs showed a normal histological structure of the liver. However, Figure (c) (HFD) showed centrilobular coagulative necrosis of hepatocytes arrow. Figure (d) (HFD+ STZ) showed disorganization of hepatic cords, fatty degeneration, and necrosis of hepatocytes arrow. Lut/ZnO NPs treatment exhibited moderate hepatocytes swelling arrow (Figure (e)) and few numbers of intracellular microvesicular steatosis arrow (Figure (f)) representing the HFD+ Lut/ZnO NPs and HFD+ STZ+ Lut/ZnO NPs respectively (H&Ex200).

