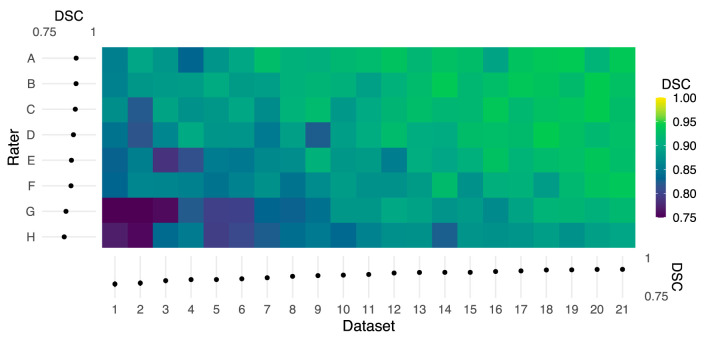
Figure 2.
Color map of Dice similarity coefficients (DSC) comparing each rater mask with the reference mask for each of 21 datasets. Both the rater and dataset axes are organized from lowest to highest average logit-transformed DSC. The margins (left and bottom) contain estimated marginal means for each rater and dataset, and error bars indicate 95% CIs. Horizontal and vertical gradient trends indicate the effect of rater and dataset, respectively, on agreement with the reference.

