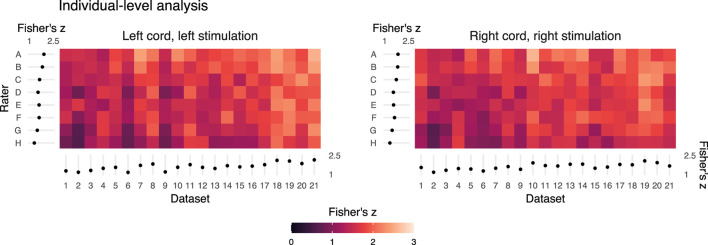
Figure 5.
Summary of the individual- (or dataset-) level activation maps. Spatial correlation of statistical activation maps derived from the individual-level analysis results of each rater and the reference, for ipsilateral activation of left- and right-sided stimulation trials. Results shown as a color map of Fisher's z correlations between rater and reference un-thresholded statistical activation maps, with the dataset order matching Figures 2 and 4. The horizontal and vertical gradient trends indicate that rater agreement with the reference mask and dataset factors influence agreement with the reference individual-level statistical activation maps. Marginal mean Fisher's z scores by dataset and rater are shown at the axes. Error bars on the marginal means indicate 95% CIs.

