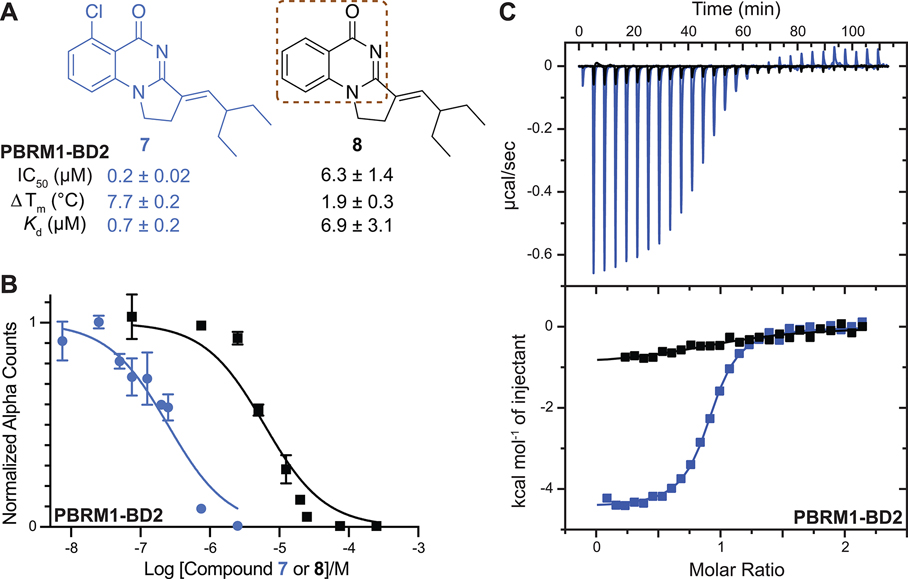
Figure 4.
(A) Compounds synthesized to evaluate potential halogen bond formation between 7 and PBRM1-BD2 backbone. The brown dashed box highlights the quinazolinone scaffold. IC50 values were obtained using the AlphaScreen assay. Tm shift values were obtained using the DSF assay. The values shown are the average of three replicates ± the standard deviation. The Kd value for each compound was obtained from ITC measurements. (B) Concentration–response curve giving IC50 values for 7 (0.2 ± 0.02 μM, blue) and 8 (6.3 ± 1.4 μM, black), as tested by the AlphaScreen assay. (C) Overlaid ITC data for 7 (blue) and 8 (black).

