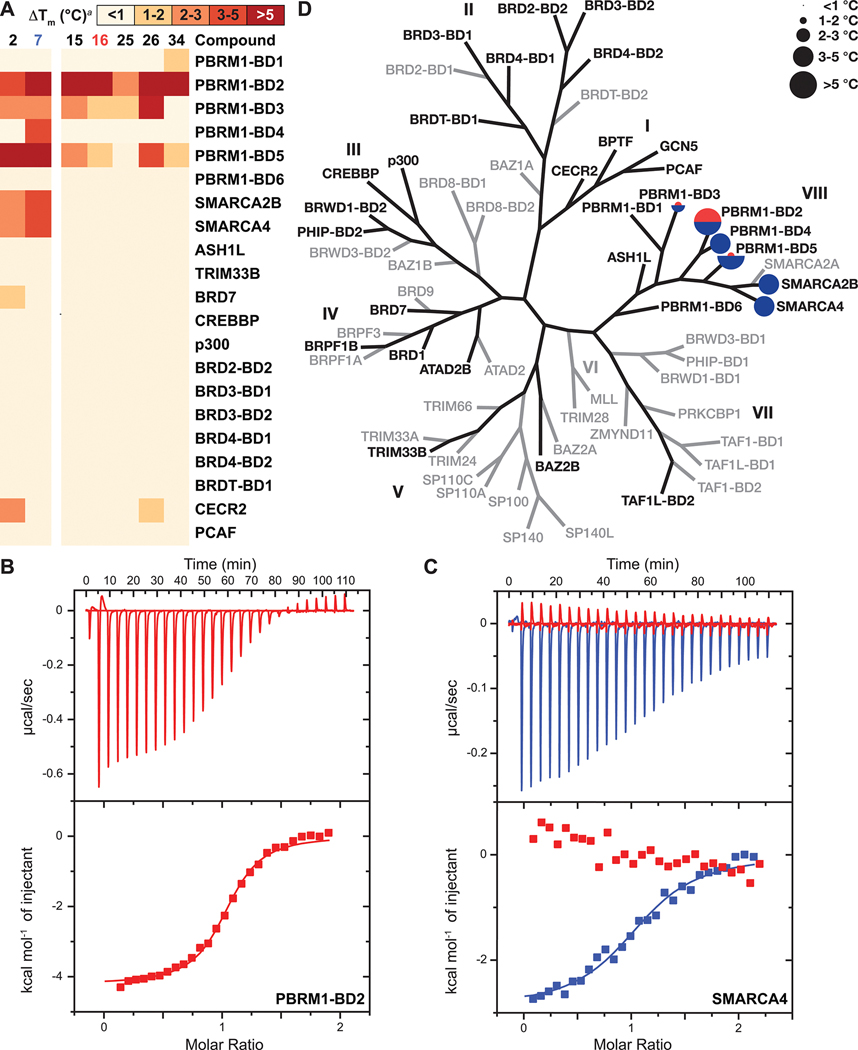
Figure 5.
(A) Heat maps showing the selectivity profile of selected compounds against the members of the bromodomain family. Inhibitors were screened at 100 μM concentration against 10 μM of the indicated bromodomains by the DSF assay. (B) Representative ITC data for 16 with PBRM1-BD2. (C) Overlay of ITC binding curves of SMARCA4 bromodomain with 7 (blue) and 16 (red). (D) DSF selectivity profile of 16 (red) and the previously reported 718 (blue) and plotted on the phylogenetic tree of bromodomain family. Roman numerals indicate the eight bromodomain subfamilies. Bromodomains shown in black were tested. Bromodomains shown in gray were not tested.

