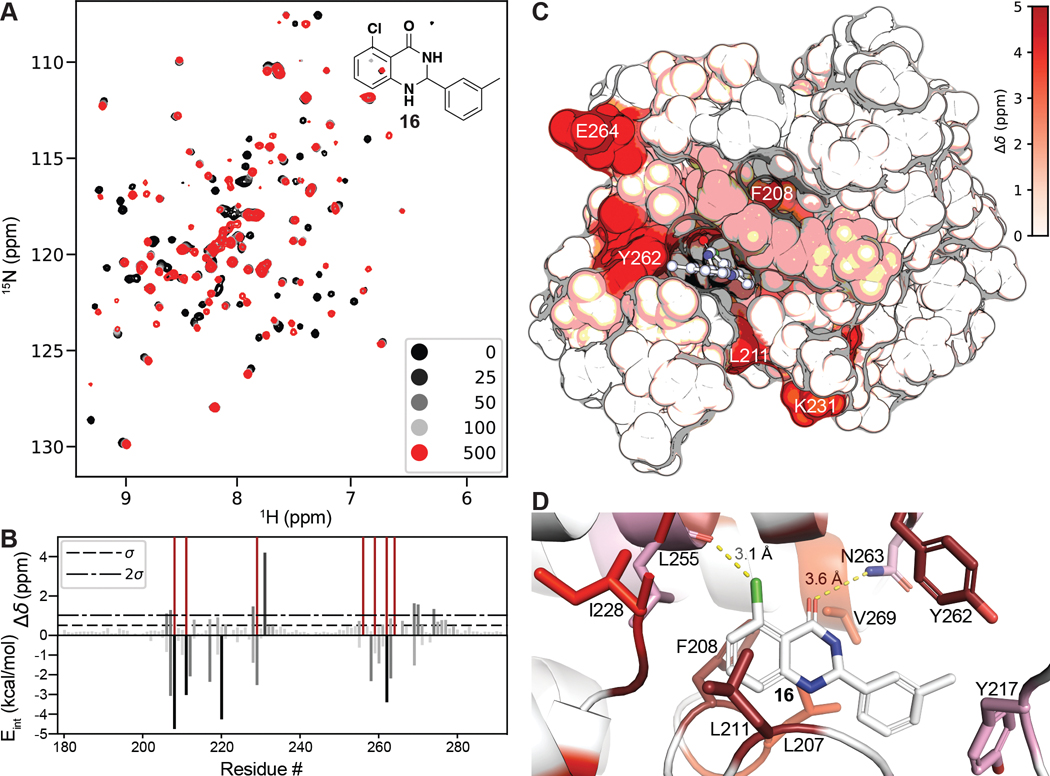
Figure 6.
(A) 1H, 15N SOFAST-HMQC overlays of PBRM1-BD2 (100 μM) titrated with 0–500 μM of 16 (structure in insert). (B) (top) Quantification of total chemical shift perturbations (1H/15N Δδ chemical shift) manifested by 16 (500 μM) for individual amino acid residues of PBRM1-BD2. Prolines and unobserved residues have a value of zero, while amino acids whose amide cross peak broadened beyond detection during the titration were assigned a value of 5 and are colored dark red. (bottom) Internal energy (Eint) values from the per residue interaction scoring (XP Glide docking) for residues located within 12 Å of the centroid of the docked ligand 16. (C) Mapping of perturbed residues to the crystal structure of PBRM1-BD2 (PDB 6ZN6). The in silico docked pose of 16 into the acetyl-lysine binding site of PBRM1-BD2 is included. (D) Binding site view of the pose displayed in (C). Residues are colored as displaying line broadening (dark red) and CSPs > 2σ (red), between 1σ and 2σ (pink), or <1σ (white).

