Figure 7.
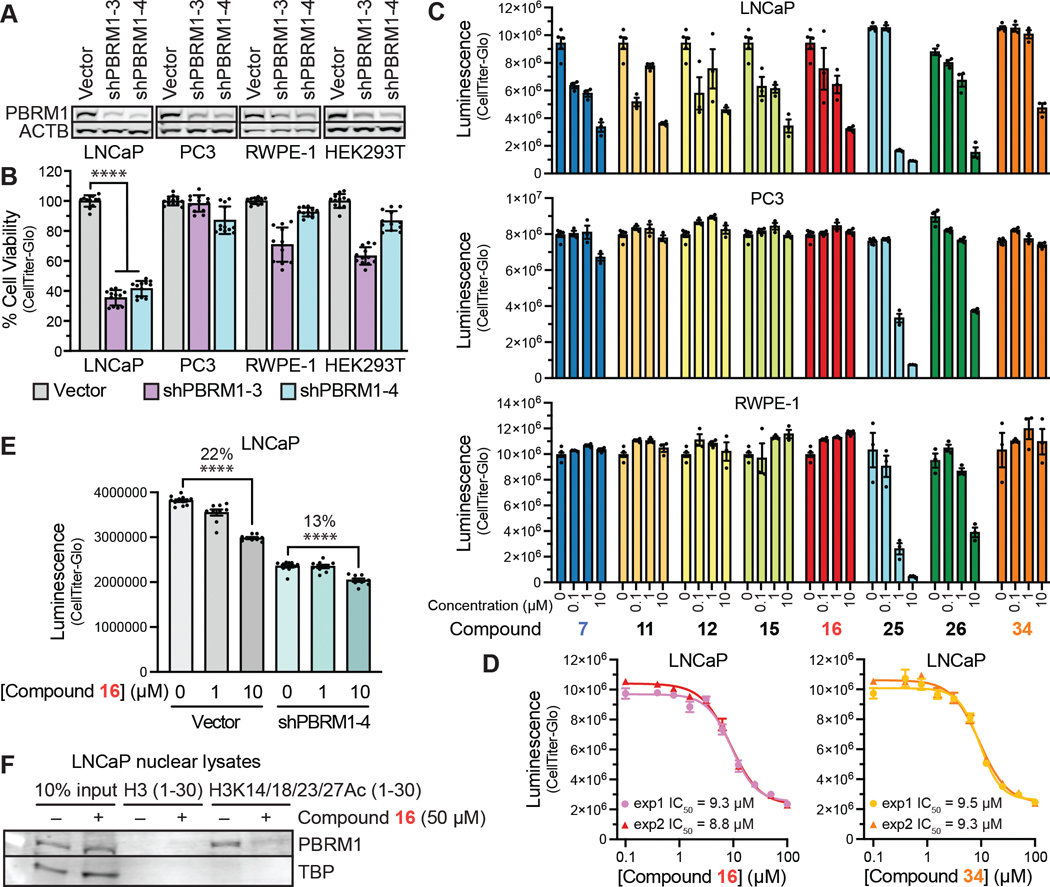
Cellular activity of PBRM1-BD2 inhibitors. (A) Immunoblot of lysates from human cell lines with lentiviral expression of two shRNAs against PBRM1 (shPBRM1–3 and shPBRM1–4) or vector control. Cell lines include LNCaP (AR-positive prostate cancer cell line), PC3 (AR-negative prostate cancer cell line), RWPE-1 (prostate epithelial cell line), and HEK293T (transformed human embryonic kidney cell line). (B) Cell viability after 6 days incubation of cell lines expressing lentiviral shPBRM1 or vector control. (C) Prostate cell line viability after 5 days treatment with 0, 0.1, 1, or 10 μM of indicated PBRM1 bromodomain inhibitors. Viability was measured as luminescence units using CellTiter-Glo. n = 3 for compound treatments; n = 6 for DMSO alone. (D) Concentration curve measurement for 16 and 34 in LNCaP cells treated as described in (A). IC50 was calculated from the variable slope concentration curve generated using GraphPad Prism. (E) The viability of LNCaP cells expressing shRNA against PBRM1 (shPBRM1–4) or vector control after 5 days treatment with 0, 1, or 10 μM compound 16. Viability was measured as luminescence units using CellTiter-Glo. n = 9–12; **** = p < 0.0001. Significance calculated using Student’s t test. (F) Immunoblot analysis of streptavidin-mediated enrichment of biotinylated H3 or H3K14/18/23/K27Ac tetraacetylated peptides added to LNCaP nuclear lysate containing 250 mM NaCl. Enrichment of PBRM1 and TATA-binding protein (TBP) was determined using immunoblot analysis.

