Table 1.
Hits Using Protein-Detected NMR Fragment Screening of PBRM1-BD2
| Compound | Structure | PBRM1-BD2 NMR Kd (μM) | LEb | PBRM1-BD2 ΔTm (°C)a |
|---|---|---|---|---|
| 5 |
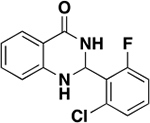
|
45.3 ± 8.1 | 0.31 | 1.0 ± 0.2 |
| 6 |
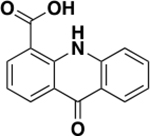
|
79 ± 35 | 0.33 | 1.5 ± 1.0 |
| 6a |

|
170 ± 35 | 0.4 | 1.0 ± 0.1 |
| 6b |

|
902 ± 270 | 0.4 | ND c |
| 6c |
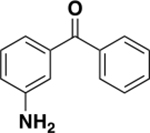
|
709 ± 211 | 0.29 | ND c |
| 6d |

|
1387 ± 262 | 0.23 | ND c |
| 6e |
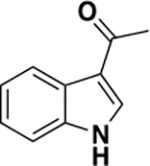
|
1195 ± 250 | 0.33 | ND c |
| 6f |
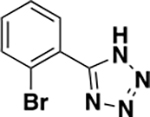
|
1446 ± 599 | 0.32 | ND c |
| 6g |

|
1210 ± 267 | 0.3 | ND c |
| 6h |

|
>2000 | N/A | ND c |
| 6i |
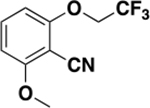
|
>2000 | N/A | ND c |
| 6j |
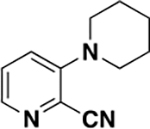
|
>2000 | N/A | ND c |
Values are the average ± standard deviation of three replicates.
LE represents Ligand Efficiency.
Tm shift not determined/tested by DSF assay.
