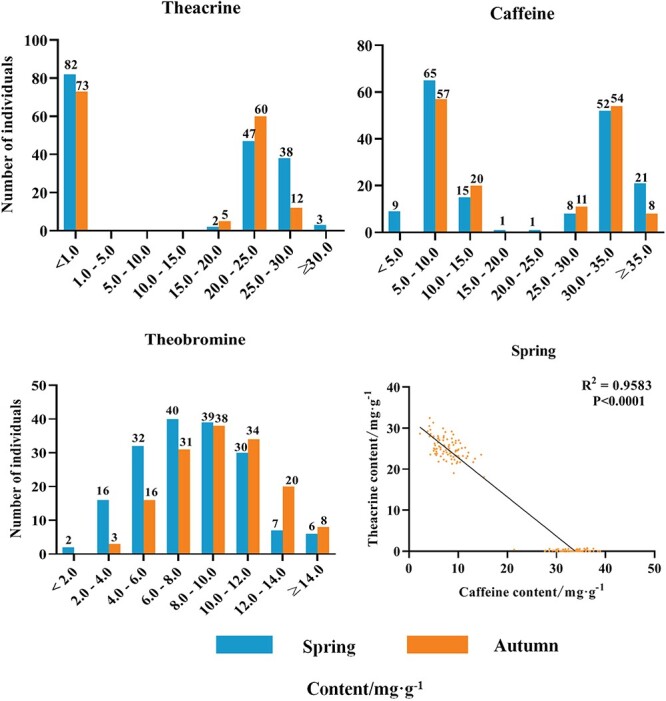
Figure 1.

Distribution of purine alkaloids content in the ZC × RY F1 population. The vertical axis represents the number of individuals, and the abscissa represents the content of purine alkaloids. Correlation between theacrine and caffeine tested using Pearson’s correlation analysis.
